Effect of Partial Shading
As was evident in the previous example, the upgraded 4-panel system did not quite have enough juice to keep the refrigerator going long-term. Seeing that I just needed a few percent of extra energy per day, I decided to abandon the tilt-support structure for the summer. These supports allow panel tilt adjustments at 10° increments via a series of hooks on vertical posts on the north sides of the panels. The supports are similar to the ones pictured in the Physics Today article, but larger.
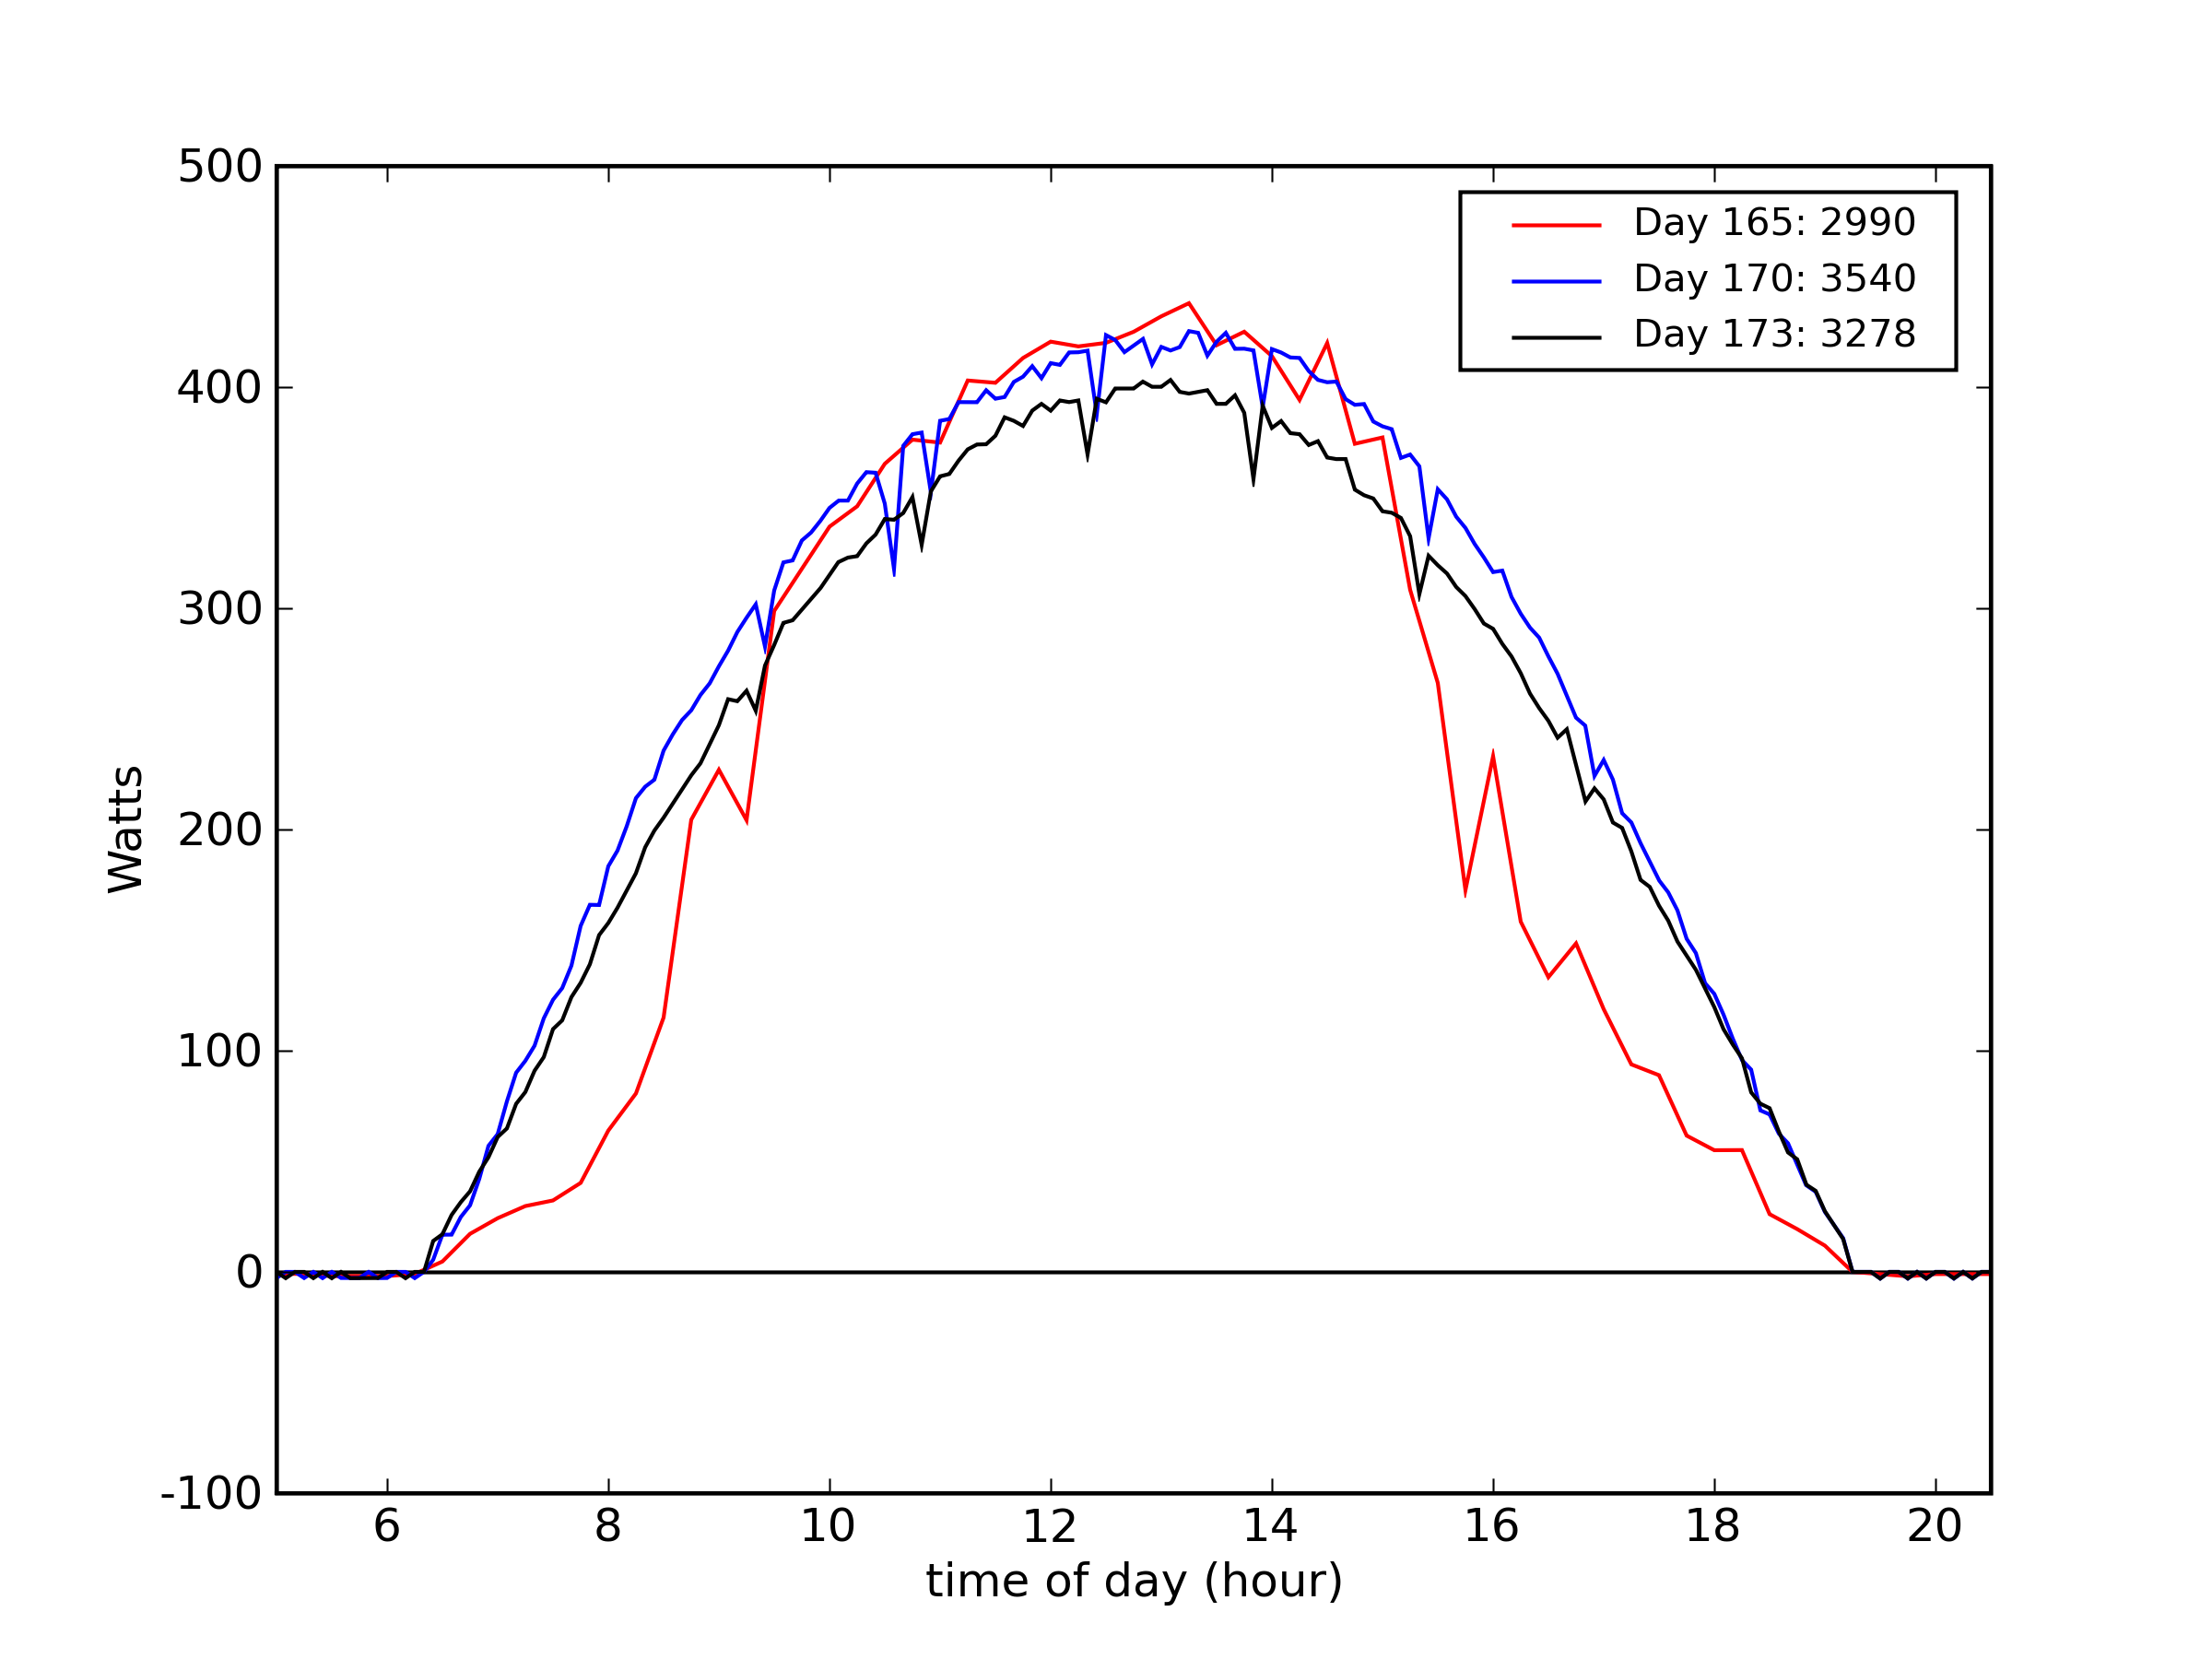
The vertical posts cast shadows on the panels during the summer mornings and evenings, when the sun spends a significant amount of time north of the east-west line, and the panel is at a low (10°) tilt for the season. Even though the shadows do not take up much of the overall area, the series arrangement of the PV cells means one can see substantial losses. The plot above shows the result of three different days when the PV system ran full-out on cloudless days (never fully charging the battery on these three days). The red curve is the "before" case when partial shading diminished morning and evening yield. The blue curve is a comparable day after laying the panel flat, with no local obstructions. This resulted in 18% more energy gathered for the day (3540 W-h vs. 2990 W-h). The curves during the fully-illuminated mid-day are in good agreement, the biggest difference in appearance owing to different sampling intervals (15 minutes for the red curve; 5 minutes for the blue curve).
The blue curve now looks like part of a cosine function, sloping purposefully during the morning and evening segments, as should be the case.
Also shown is the black curve, which is also for the flat (no-tilt) panel, on the summer solstice. Also on this day the battery was not fully charged so that the PV system delivered maximum power all day. Why is the black curve less than the blue curve (by 8%)? Because this was a really hot day in San Diego: approaching 40°C (over 100°F) at our location. The PV panels lose efficiency at higher temperatures. At this level, subtle variations in atmospheric transparency can also contribute to the total effect—which I suspect accounts for part of the 8% drop seen here.You may also notice the similar patterns of dips in the blue and black curves, shifted by five minutes between the two. These are not physical obstructions (shadows), but the result of the charge controller executing a restart every 90 minutes—during which it ceases to deliver solar current to the batteries momentarily. The exception to the perfect periodicity seen in the blue curve is probably a real obstruction (cloud or contrail).
Previous Data Set | Next Data Set