Sunny Days
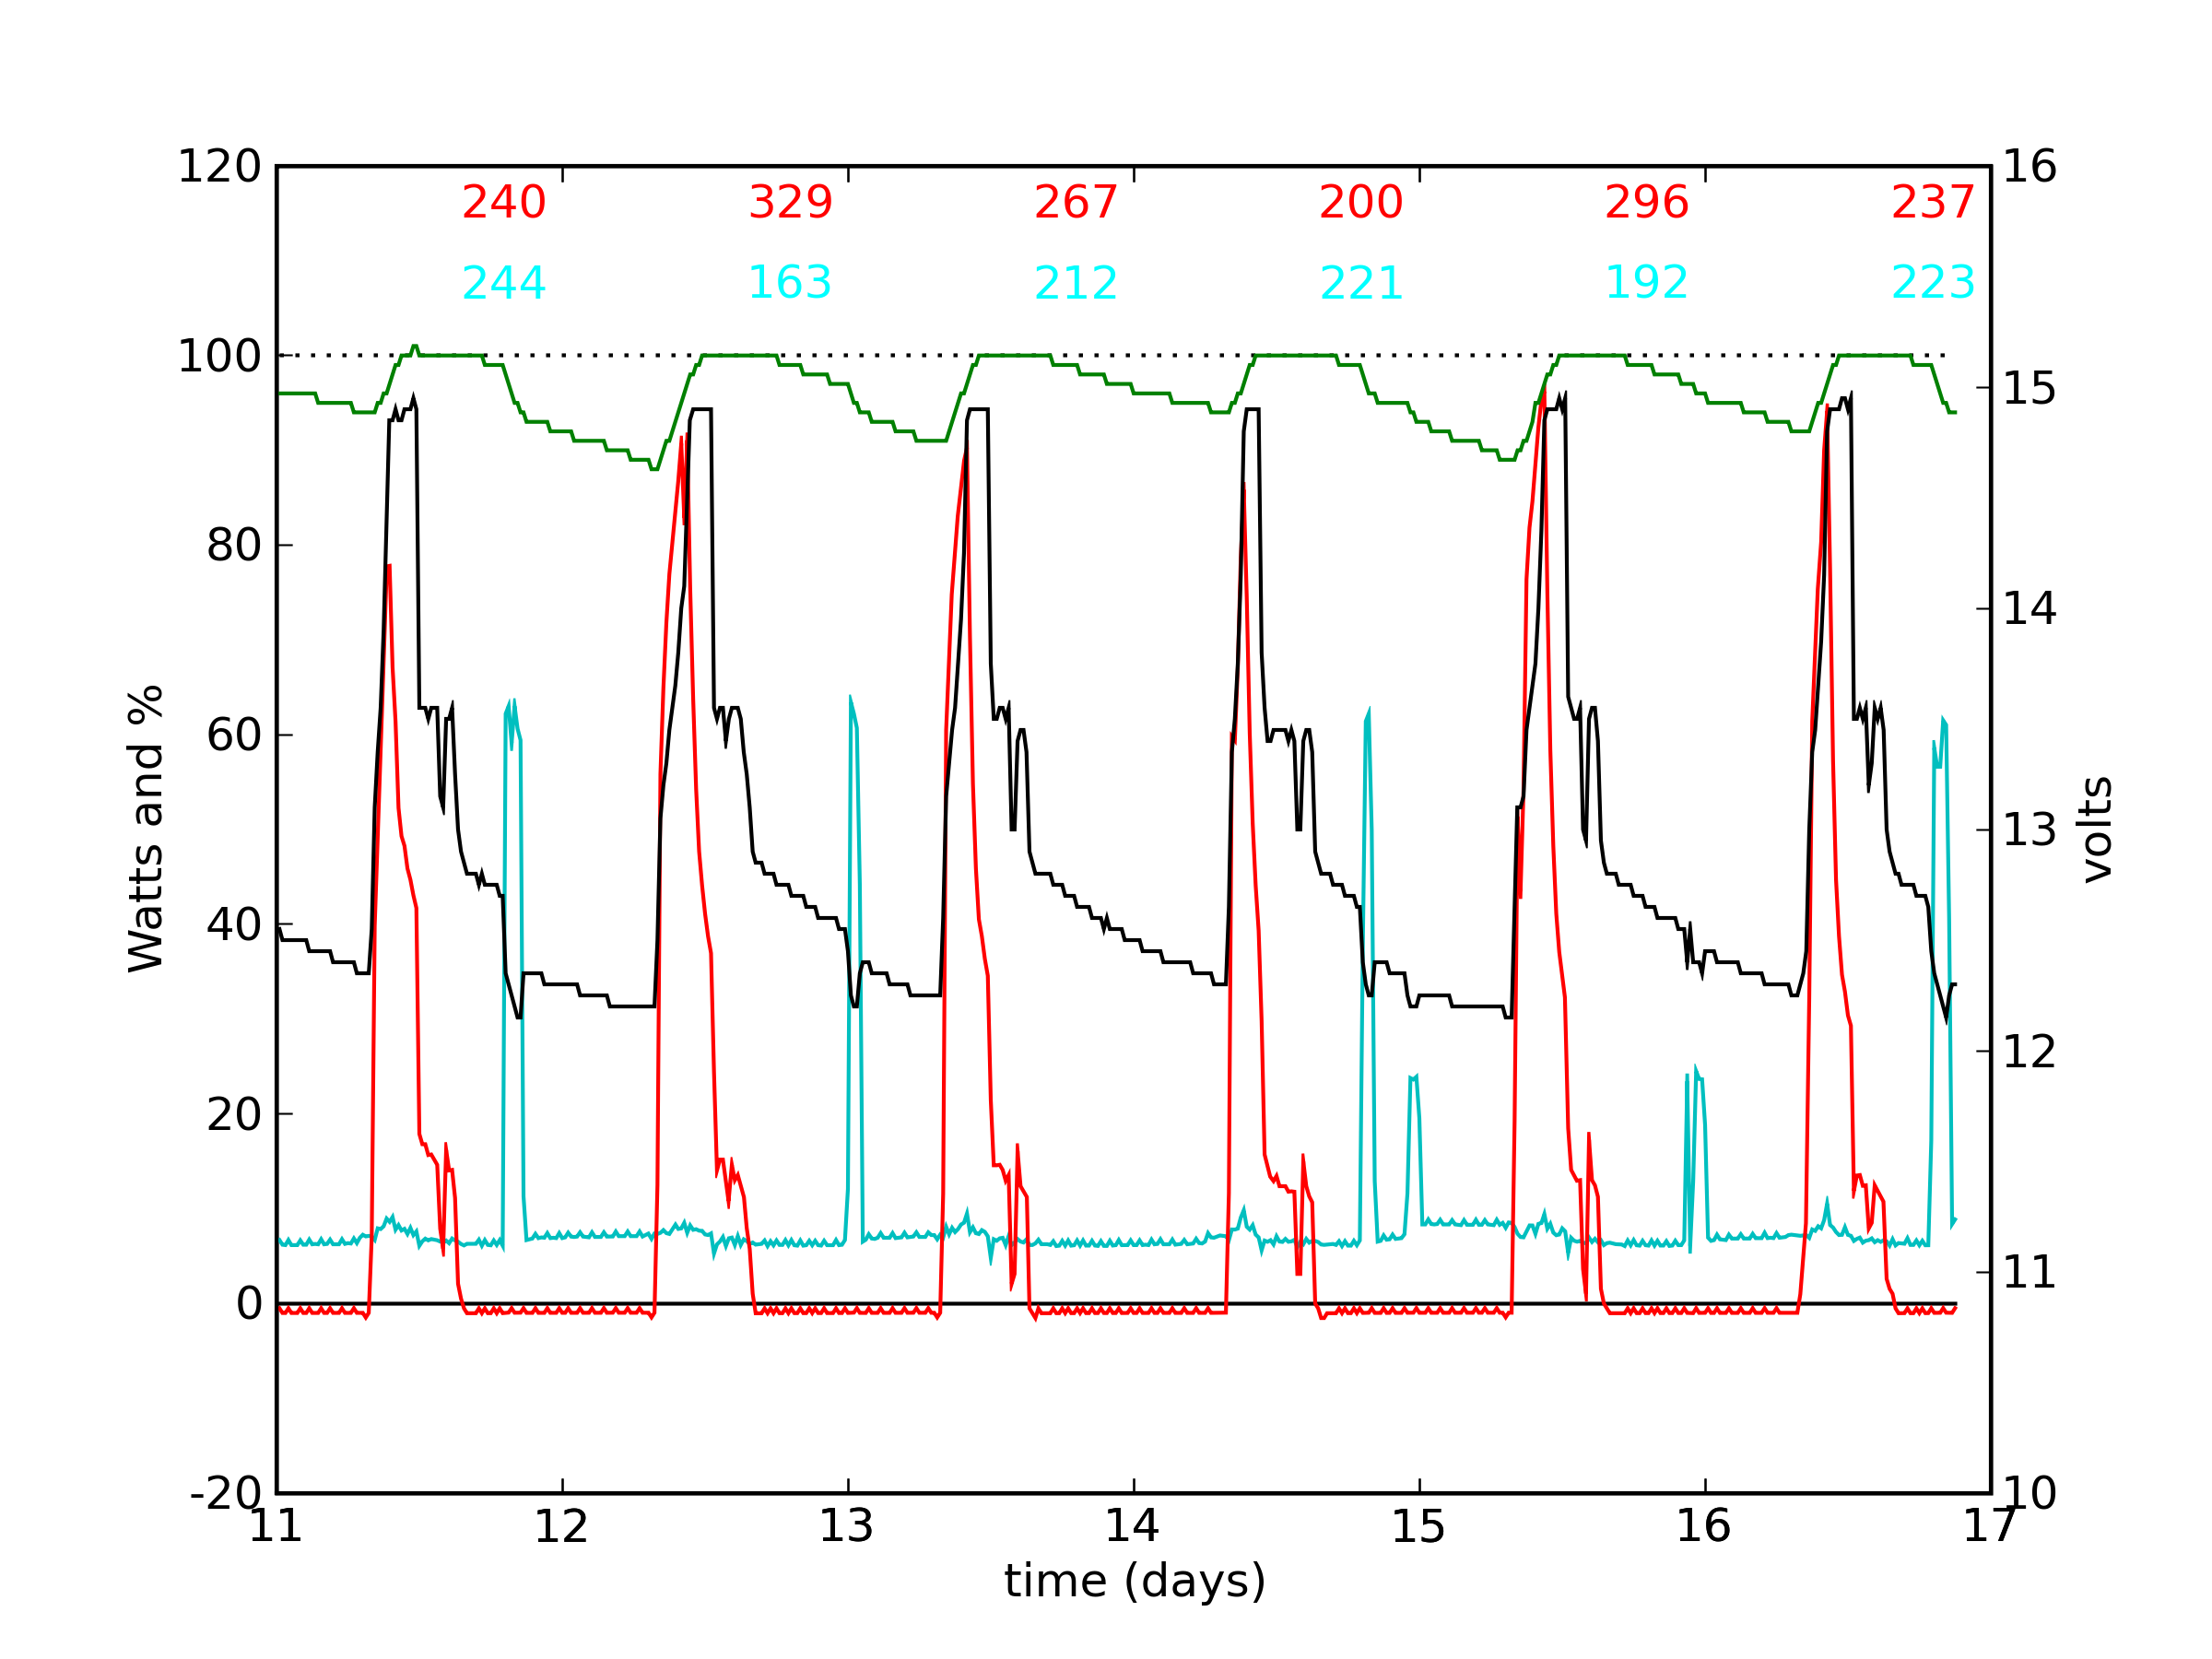
A series of sunny days and normal usage activity for the entertainment system. Every day saw the battery fully charged: this is seen via the 100% achievement in the green curve, but more tellingly in the completion of absorb stage followed by float stage in the battery voltage record. Note the dip that daily interrupts the float stage, due to the shadow of a tall palm tree trunk that crosses the panel each day around 2 PM. Note in the red curve that the panel is effectively killed despite the shading being partial. I am not sure why days 12 and 16 are not as severe. It could be that winds swayed the tree on these days and kept its shadow from dwelling on the panel 100% of the time. Even a little bit of full exposure would boost the power enough to keep float stage happy—requiring less than 5 W on average.
The first day is 2008 11 January, which was a Friday. I can predict that the load activity consisted of the News Hour and Washington Week on Friday night, part of Saturday Night Live the following night, nothing Sunday, the News Hour on Monday (partial), followed by the VCR taping the "fake news" shows from 11 PM until midnight (also on Tuesday night). Yes, monitoring solar usage is a form of spying, my wife likes to point out.
If we add the solar input numbers along the top, we get 1569 W-h over six days. The load total is 1255 W-h. Though subject to "edge effects," we can get some sense of the net battery energy efficiency. In this case it is about 80%. This is identical to the result I calculate for longer time periods, for which edge effects have less influence on the result.
Previous Data Set | Next Data Set