Different Light Levels and Cell Phone Charging
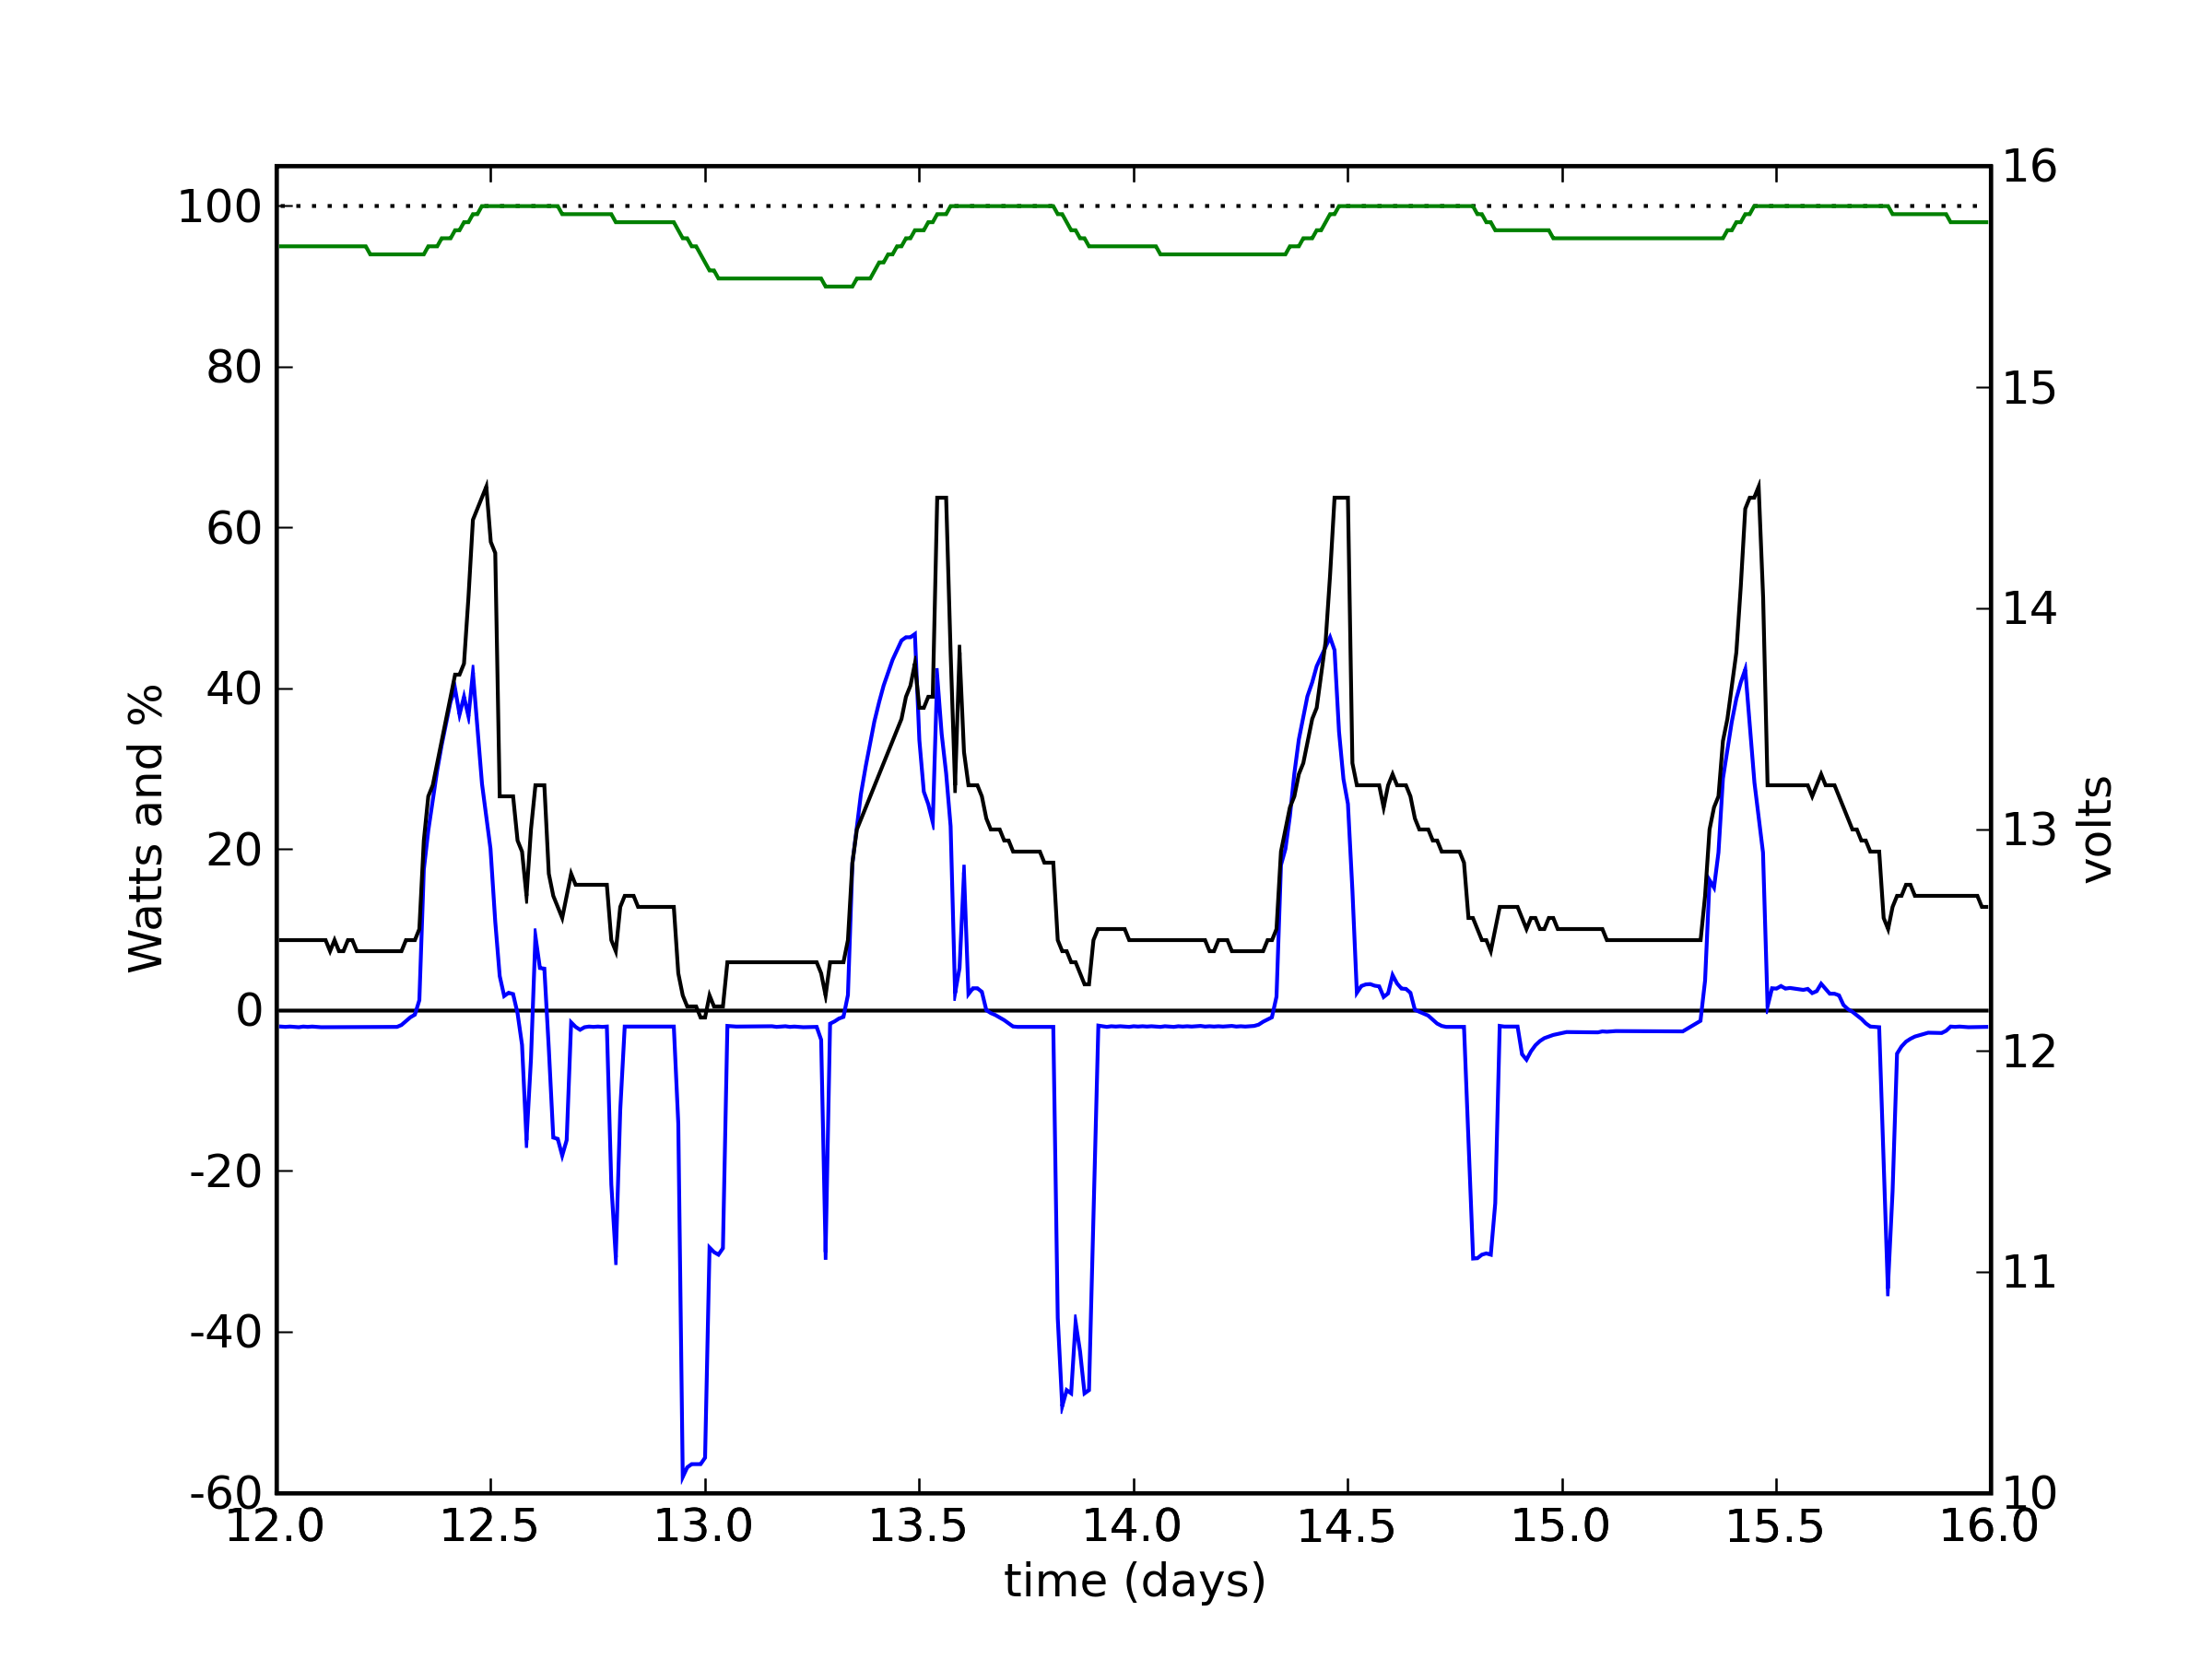
In this sequence on system #2 (lighting system), we see the lights used at a few different levels. During the day on day 12, it appears that the lighting (or more likely a laptop computer) was used sometimes during the day. That night, two lights ran at 30 W each for a while, immediately followed by a period when only one was on. The level near the end of the 13th day is inconsistent with lights alone (30, 35, 65 W choices, times two), so was very likely a combined lights/laptop period (also explains the notch in the middle of this activity, if a short break was taken from work on the laptop).
After the lighting activity on the evening of the 14th (characteristic 30 W level), a cell-phone was charged. The signature is a rapid ramp-up (here negative) in current followed by a slow decline back to nearly zero current. Note that the steady-state level after the charge is complete is a little farther from zero than the off-state normally is—perhaps by about 1 W.
The spike at the end of this time series looks like a cell phone plugged in to charge at the same time a light was turned on. Note the tail and its similarity to the previous cell-phone-charge tail. The joint amplitude is also about right. The cell phone was unplugged before going to bed this time, and we see the baseline return to its normal value just before the end.
Previous Data Set | Next Data Set