Intro to PV Time Series
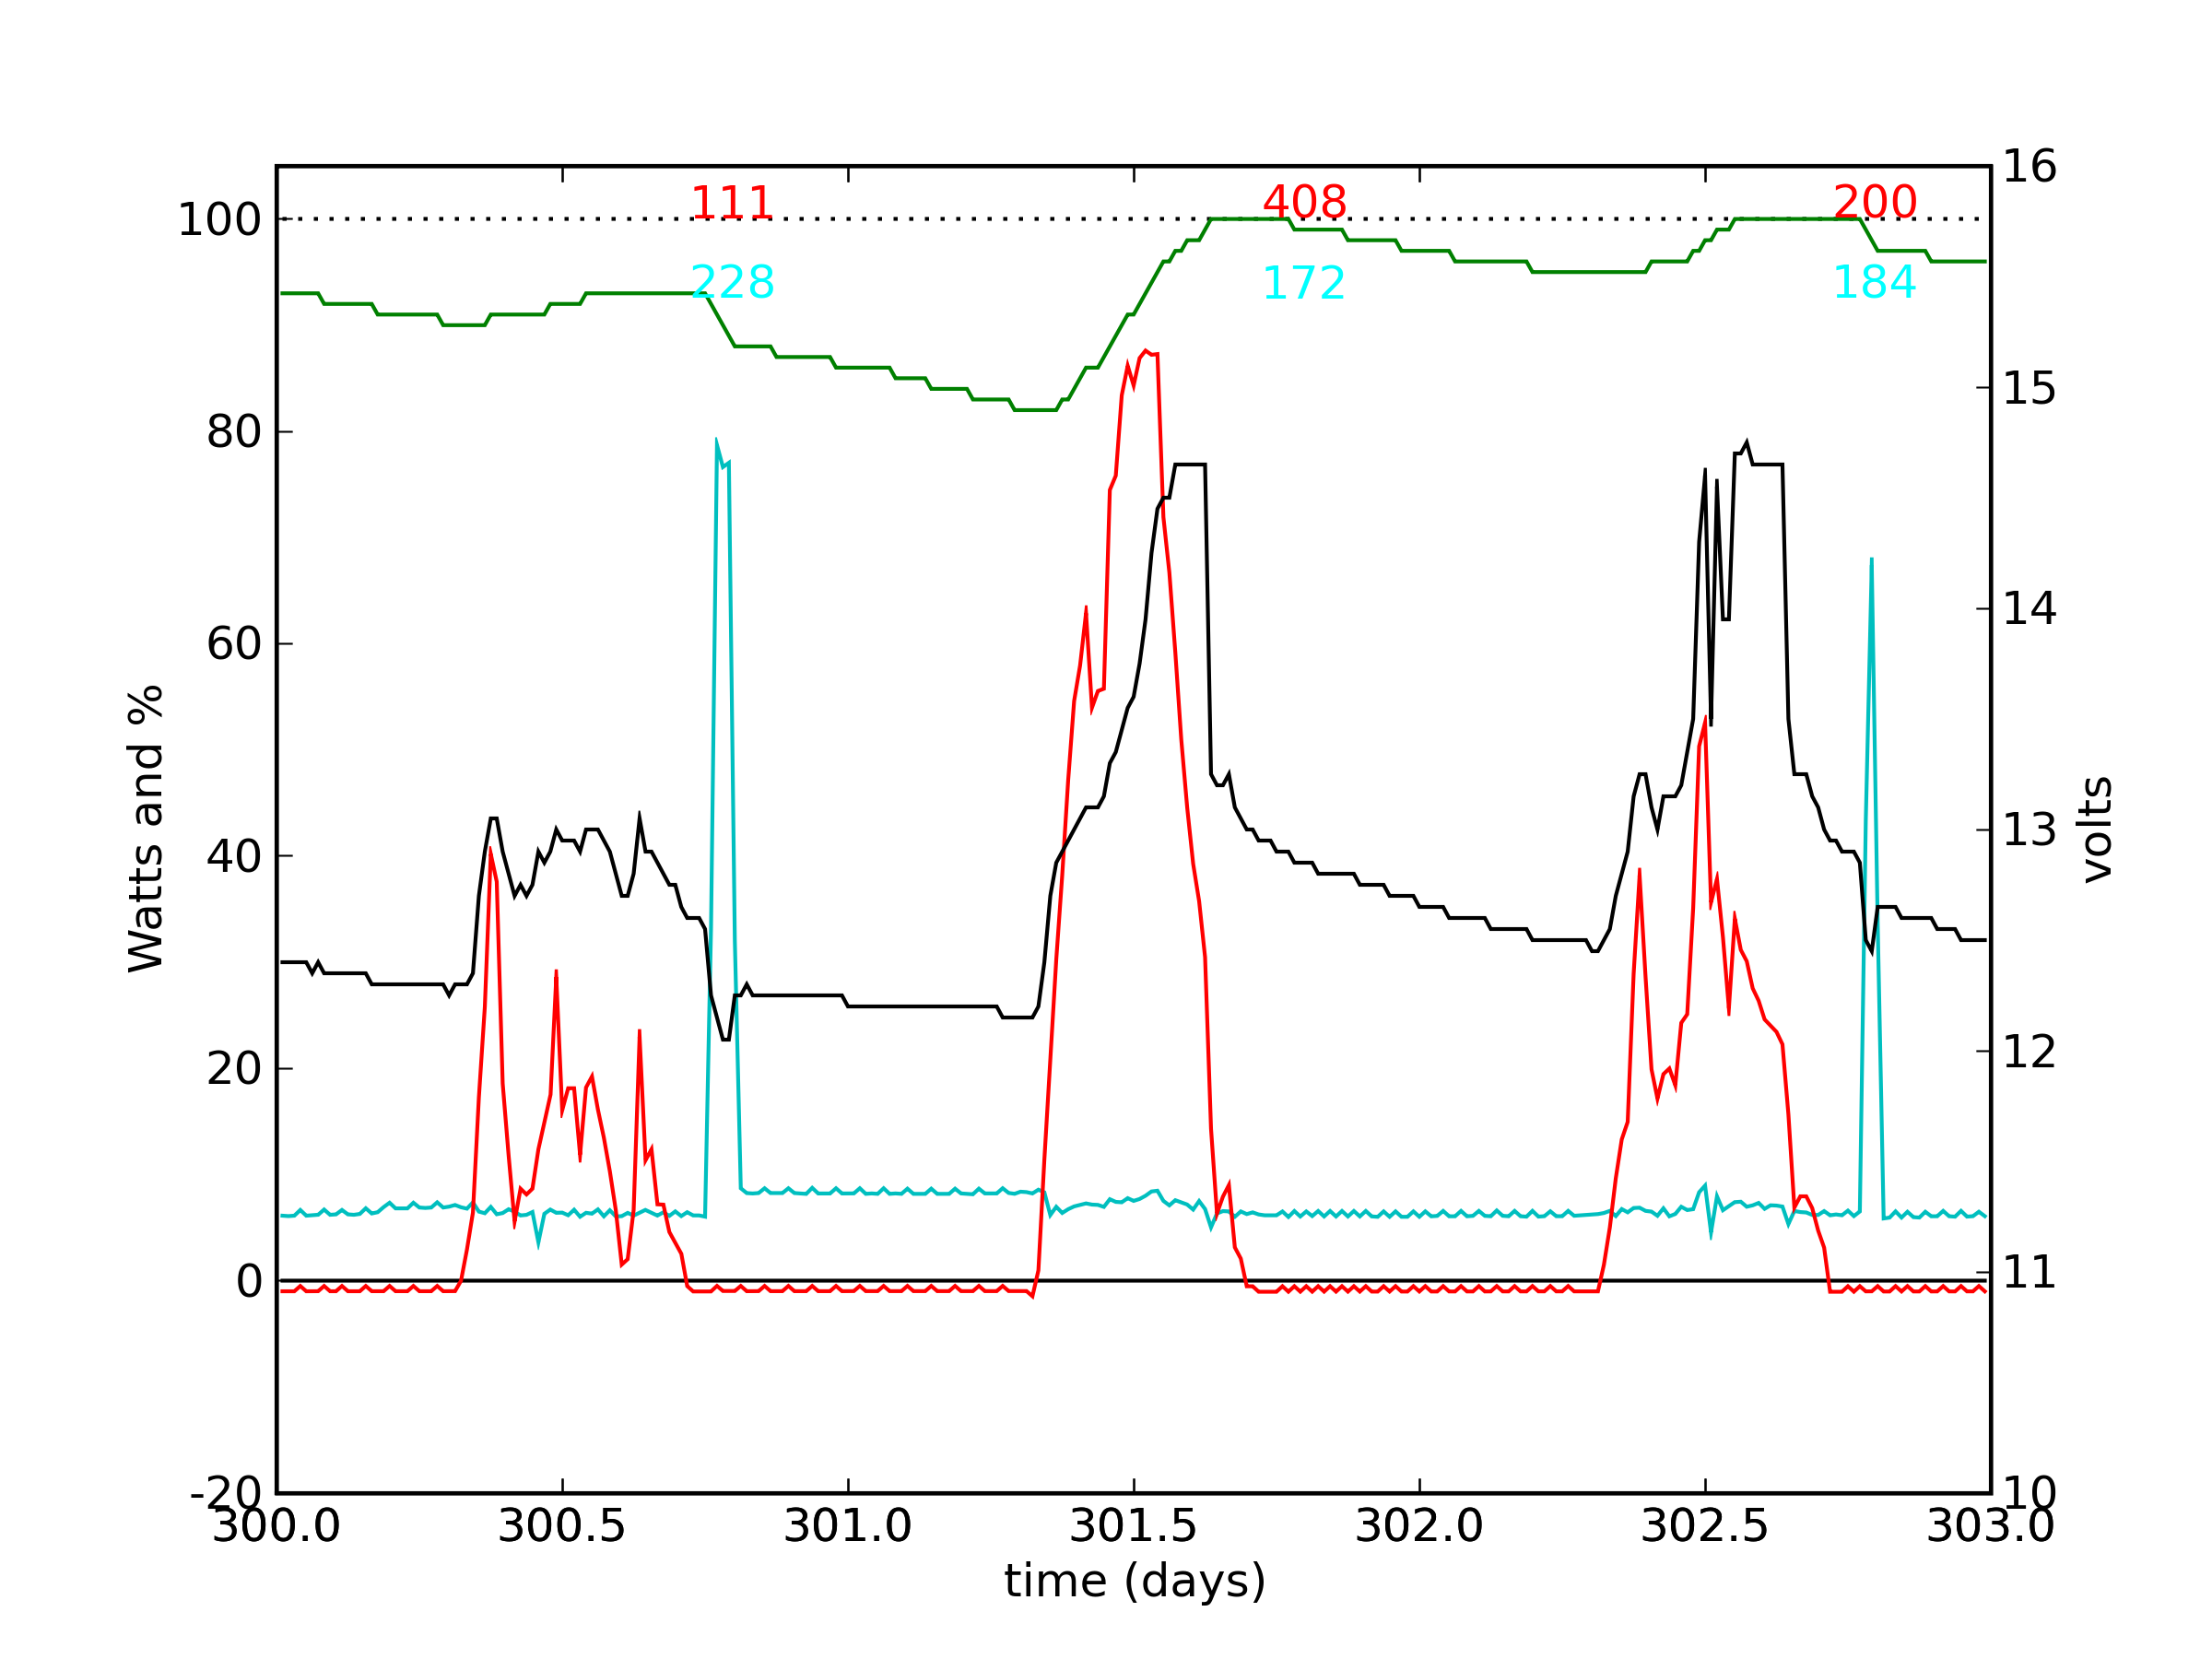
This is the same data set that appeared in the Physics Today article. Much of this caption follows from the article. Shown here is sample data for a 130-W solar panel powering an entertainment system in late October, 2007. Day 300 had a heavy but variable overcast; day 301 was mostly sunny; day 302 was cloudy. The red curve traces the solar power delivered by the panel to the charge controller, and the cyan curve traces the load. Note the constant "off" load plus brief intervals of television usage. The black curve is battery voltage, with associated scale on the right. The battery reached the absorption stage voltage on days 301 and 302 and also showed brief intervals of float stage (small "shelf" at 13.4 volts)—indicating a fully charged battery—at the end of both days. The green curve indicates battery charge as a percentage of capacity. The first day made only a small positive contribution to the battery charge, but the sunny day that followed made up for the deficit. Note that the falling edge of the solar power on the sunny day is not due to a decline in illumination, but reflects the diminishing current demand in maintaining absorption-stage voltage.
At top are numbers in red and cyan indicating the 24-hour total Watt-hours accumulated for the solar input and the load, respectively.
A few extra quirks are worth pointing out: The red curve spends the night in negative territory, with a periodic ripple. This is due to two effects: the solar panel actually does receive some leakage current at night. If it were not for the charge controller blocking most of this, the battery would quickly discharge through the forward-biased p-n junction that we call the solar panel. Second, the monitor accumulates amp-hours and reports at regular intervals—15 minutes in this case. The actual reverse current was −0.07 A, which typically turned into −0.02 A-h 75% of the time, and −0.01 A-h the other 25% of the time. The digitization results in the ripple.
The battery percentage full is tracked by the monitoring system, and must assume a charge efficiency. The system resets to 100% if it detects absorb-state voltage and low current, meaning the charge cycle is at or near its end. If enough time goes by without such a cue, the % full indicator may drift away. My system is set to the conservative side (assume worse charge efficiency than I actually get), so that on Day 301 the % full abruptly jumps from 98% to 100% when the 100% condition is met. This last jump in the green curve is artificial.
The cyan load curve is synthesized out of two measurement streams. It frequently shows added noise during the day (subtraction of two large numbers), though it is not obvious to me that this should cause a problem. In any case, one can ignore this "noise."
Though the panel used in this system has a 130 W nominal rating, it seldom exceeds 110 W due to thermal heating of the panel in full sun. These data were taken at a time before I had the panels oriented at optimal seasonal tilt, so the high falls short of 90 W.
Previous Data Set | Next Data Set