Physics Today Photovoltaic Supplement
An article in the July 2008 issue of Physics Today provides a how-to guide for setting up a small, standalone PV system—primarily aimed at physicists, but hopefully more broadly useful.
This page provides additional data examples, plus graphical tools for evaluating optimal tilting or tracking schemes for solar panels. The page contents will likely grow with time—both in data examples and analysis tools.
Preview: This page contains links to a number of data time series
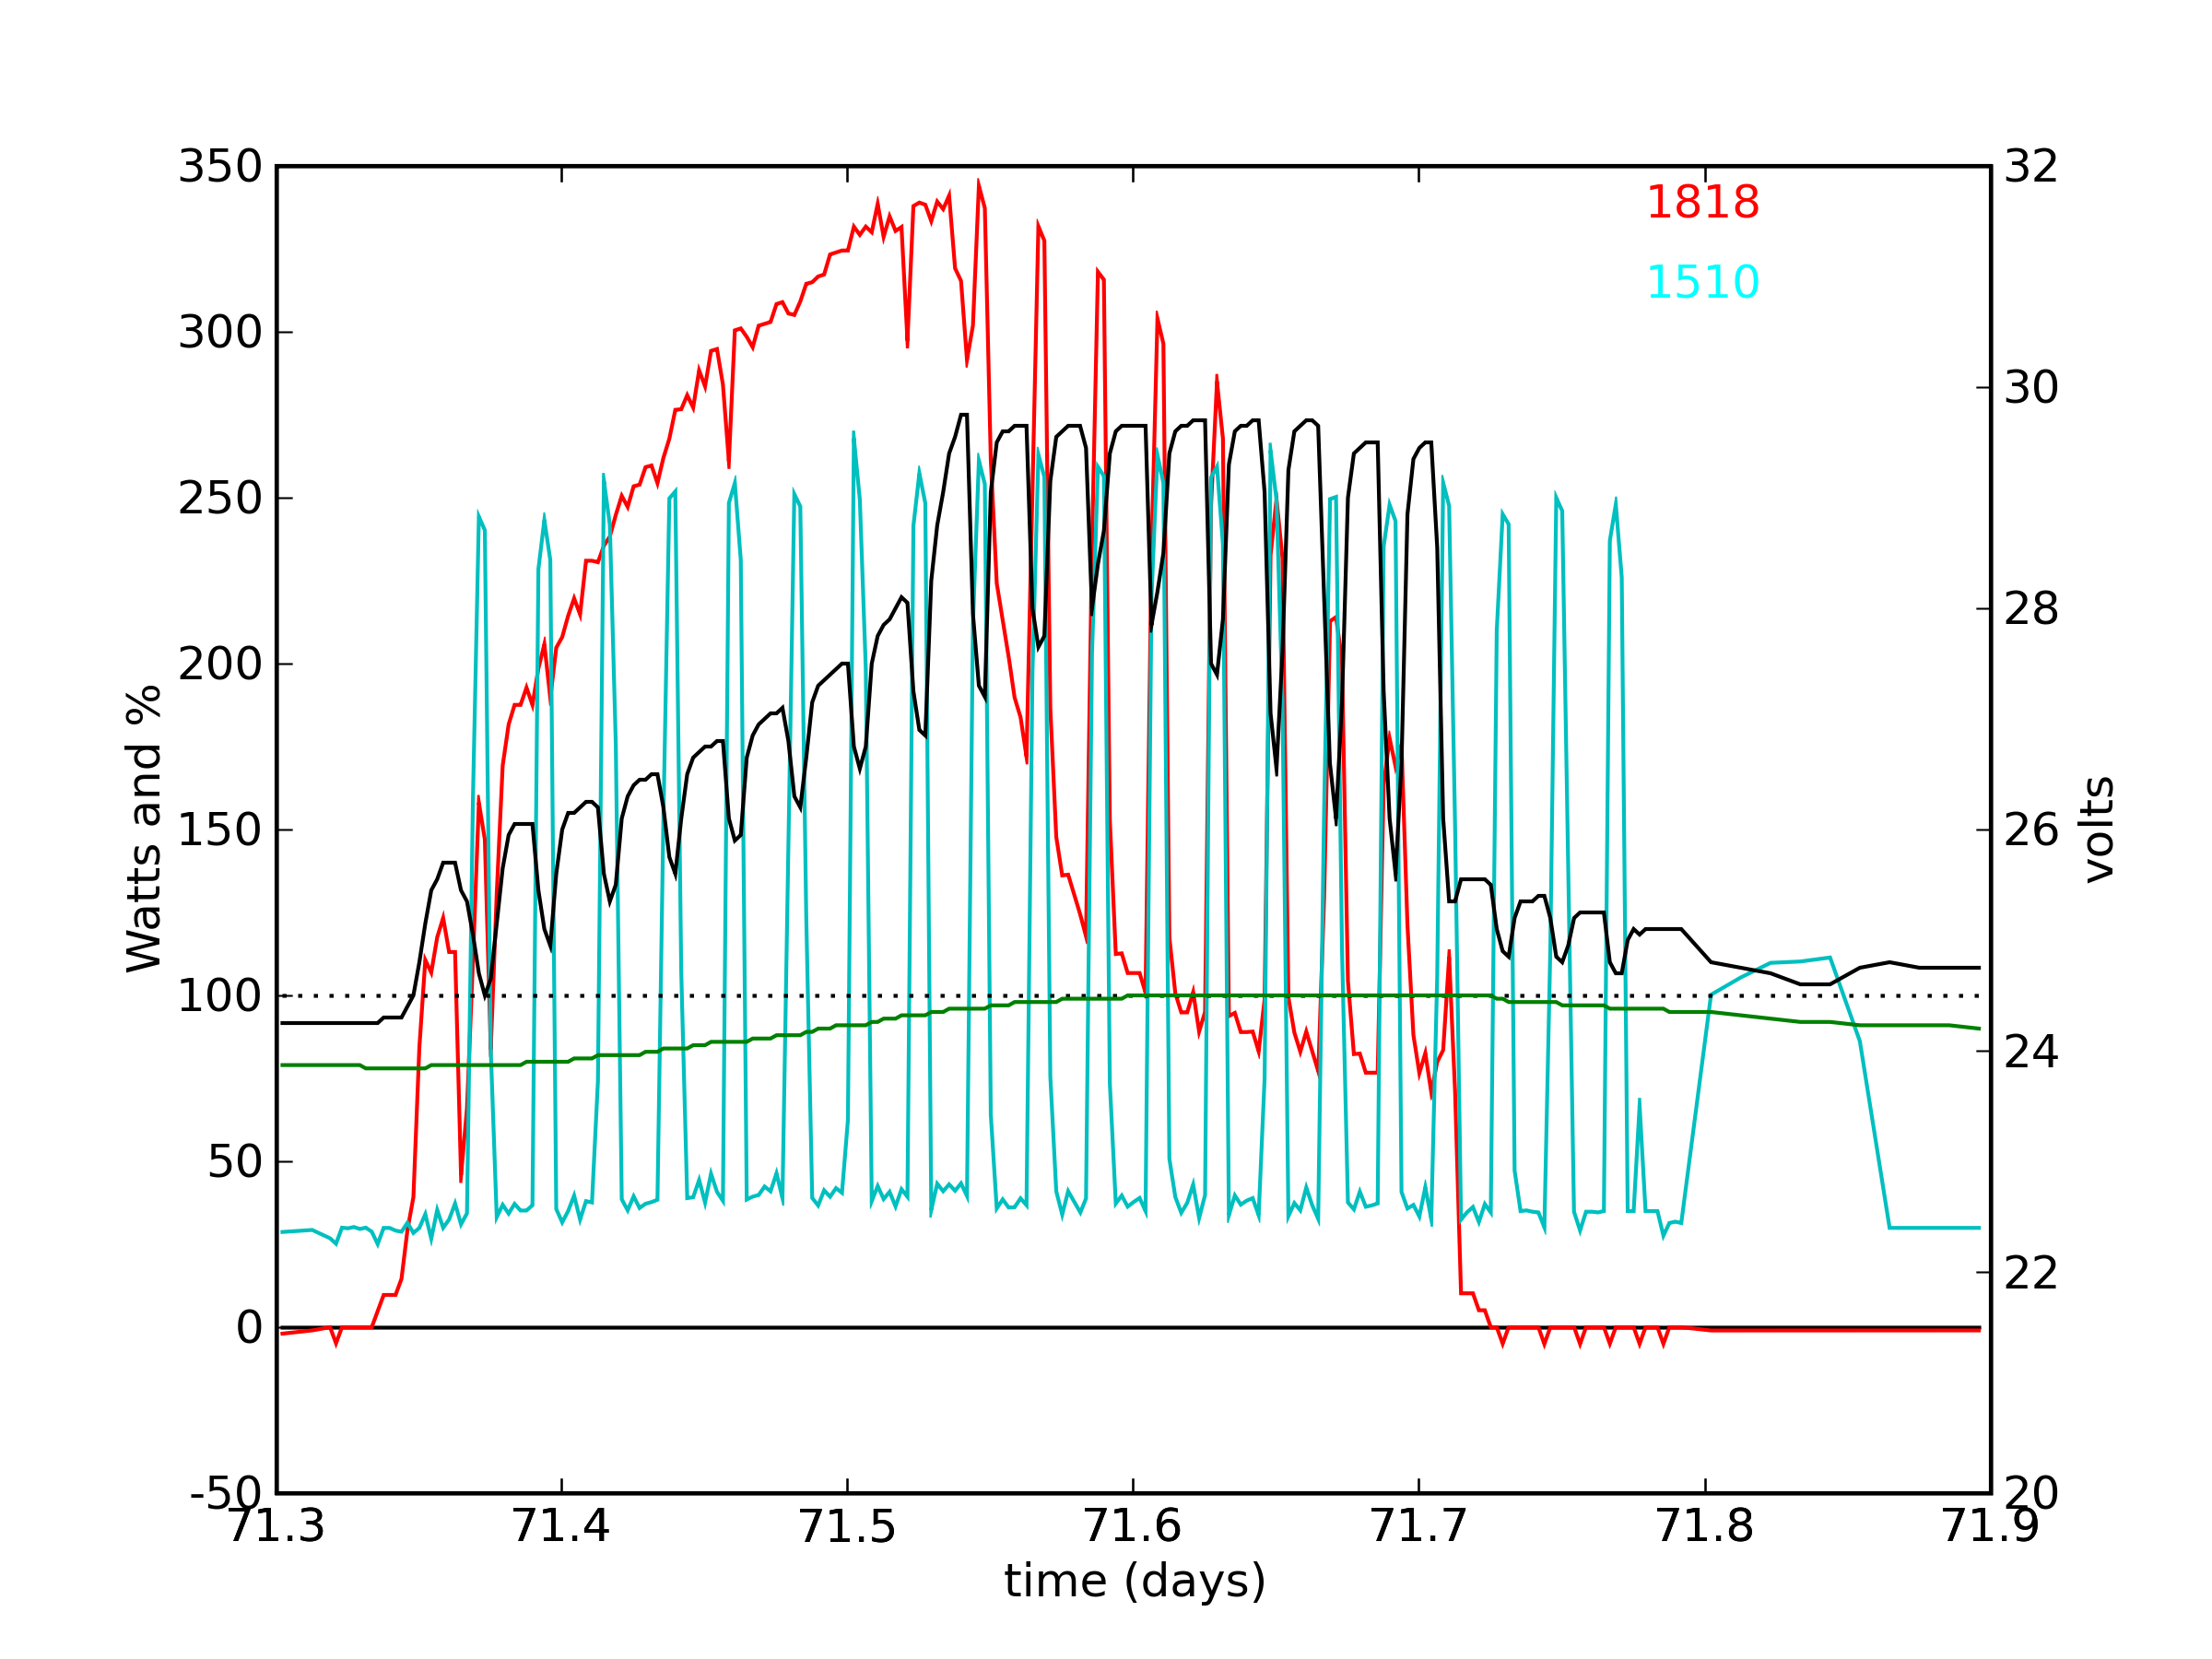
like the one at left, relating to my stand-alone solar photovoltaic
(PV) system as described in the July
2008 article in Physics Today. The example at
left is of a refrigerator cycling on and off throughout the day.
The red curve is solar input, the cyan curve represents load. The refrigerator
was plugged in in the morning, and unplugged after sunset. Later,
the television was run for a few hours. Click the plot to see a larger
version with a full description.
It was difficult to select for the Physics Today article a single set of example data to illustrate adequately the variety of conditions one might encounter in a home PV system. This section provides additional plots and descriptions intended to generate a deeper understanding of PV realities.
Each link below is followed by a description of what makes the associated plot interesting or worth showing. The naming convention is year-start_day-end_day-battery_system. The system described in the Physics Today article is a dual system with separate and independent panels, charge controllers, and batteries. On day 41 of 2008, I merged the system into a single system, keeping the designation #1 for the remaining system.
For system #1, I have two shunts that allow separate monitoring of the solar input current and the net battery current. Subtracting net battery current from solar input current yields a load current. The plots for system 1 show solar input current in red and load current in cyan. System #2 only has a single shunt measuring net battery current. Since this system primarily powered lights, the solar and load currents were generally separated in time, so that it is generally easy to tell these two apart.
I also provide at the bottom of the page a graphical calculator tool for adjusting the tilt of solar panels seasonally for optimal panel illumination.
2007-300-303-1: This is the data set used in the Physics Today article. Use this plot to familiarize yourself with plot features common to all plots that follow. This example is a good starting point because it offers a fair bit of variety in a three-day sequence.
2007-300-303-2: For completeness, this is the partner plot to the one above, showing what was happening in system #2 during the same period of time.
2008-011-017-1: This is a series of nearly perfect days. Though there is a 2 PM shadow that daily appears in the record.
2008-036-038-1: Optimal performance of a 130 W panel in full sun.
2008-012-016-2: Lighting, Laptops, and cell-phone charging revealed.
2007-293-294: Battery equalization, both systems.
2007-325-332: PV during vacation, both systems.
2008-001-032: A full month's activity for both systems during January 2008.
2008-040-045-1: Upgrading the system to a larger inverter, 24 V, and two, then three 130 W panels in series.
2008-071-072-1: High-resolution trace of the refrigerator cycling on and off all day.
2008-083-084-1: Washing a load of laundry from solar power! Agitate; rinse; spin!
2008-129-133-1: Upgrading the system to four 130 W panels from three. Feel the power...
2008-135-140-1: Running the refrigerator full-time for five days. Defrost cycle exposed...
Shading Comparison: The support structure was casting shades in morning and evening. This shows the impact of these partial shades, and also demonstrates the temperature dependence of the PV panel.
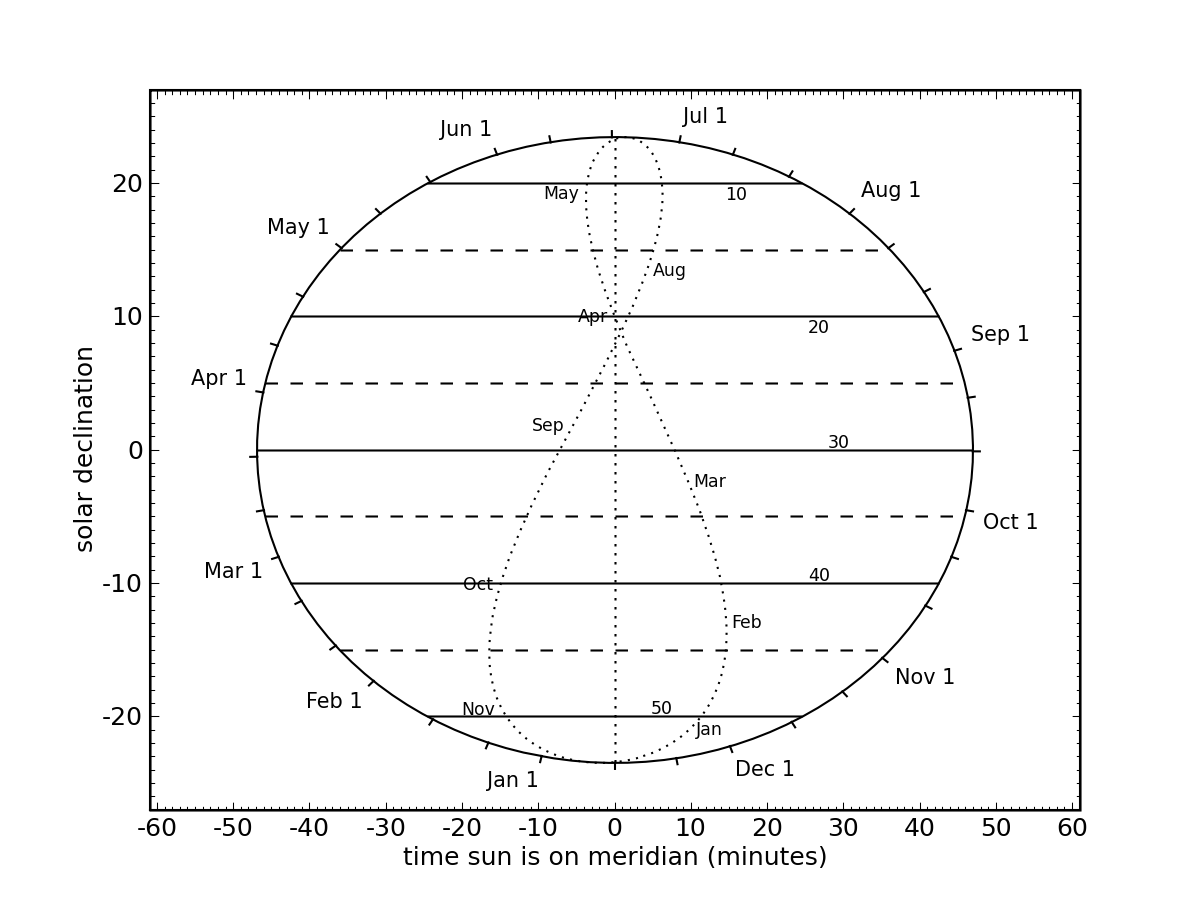
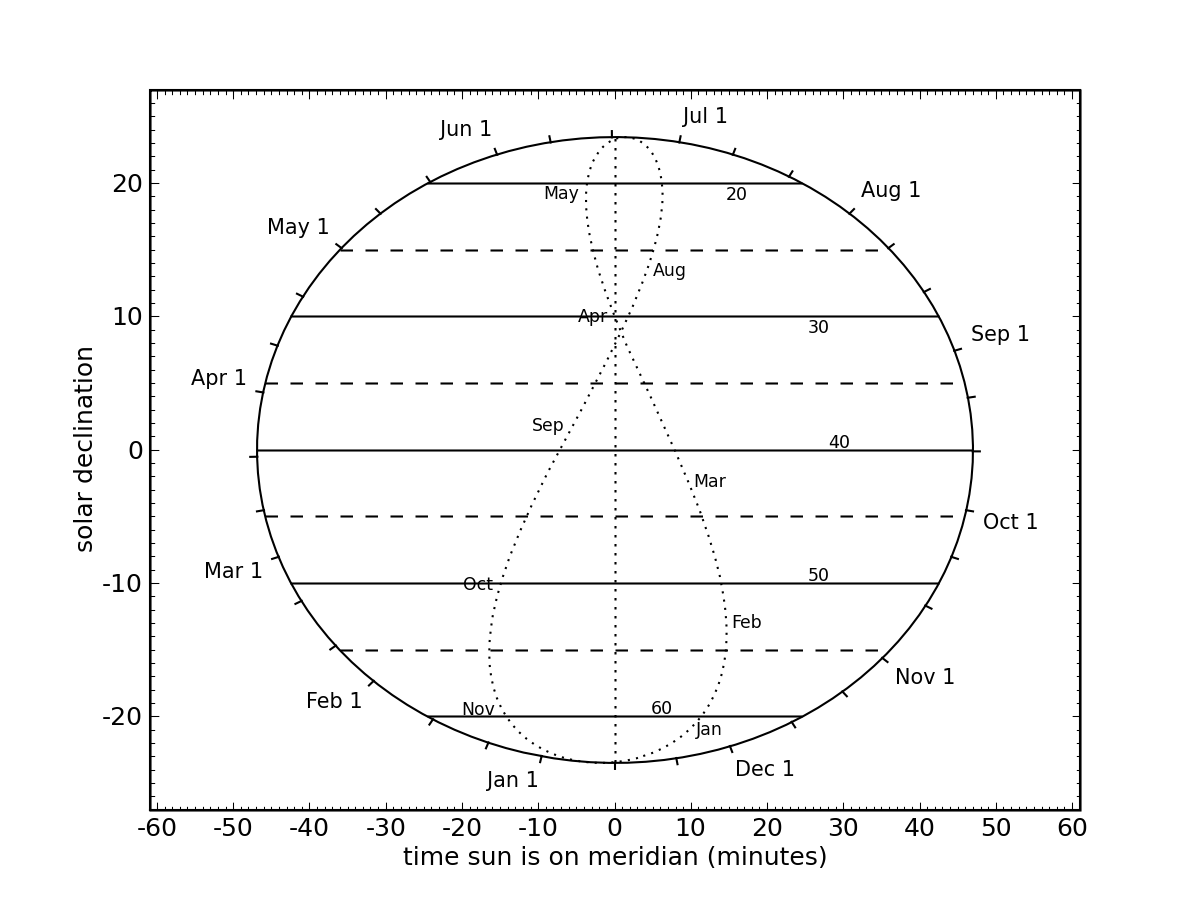
There is an easy way to anticipate the solar track through the seasons, and to adjust solar panels accordingly. As the earth "circles" the sun, the tilted axis results in a cyclic motion of the sun's declination, or angle above/below the extension of the earth's equator into space. Therefore a circle drawn on a page can represent the progress of the sun through the sky, with the vertical axis representing the sun's declination, and the distance around the circle representing time. Ellipticity of the earth's orbit around the sun will comprimize the uniform progress around the circle, but too slightly for us to worry about in the context of tilting solar panels.
A panel tilted from horizontal by the site latitude will have its normal (perpendicular) within the equatorial plane, and will therefore be ideally tilted when the solar declination is zero degrees—which happens at the equinoxes. So if we drew a line at zero declination on our graphical calculator, it would correspond to a tilt equaling the site latitude. When the sun is at a higher (positive) declination, the panel tilt angle should be reduced in the northern hemisphere, as the sun will climb higher in the sky. It is not then hard to see how one might use this circular graph to decide what the tilt should optimally be as a function of time within the year.
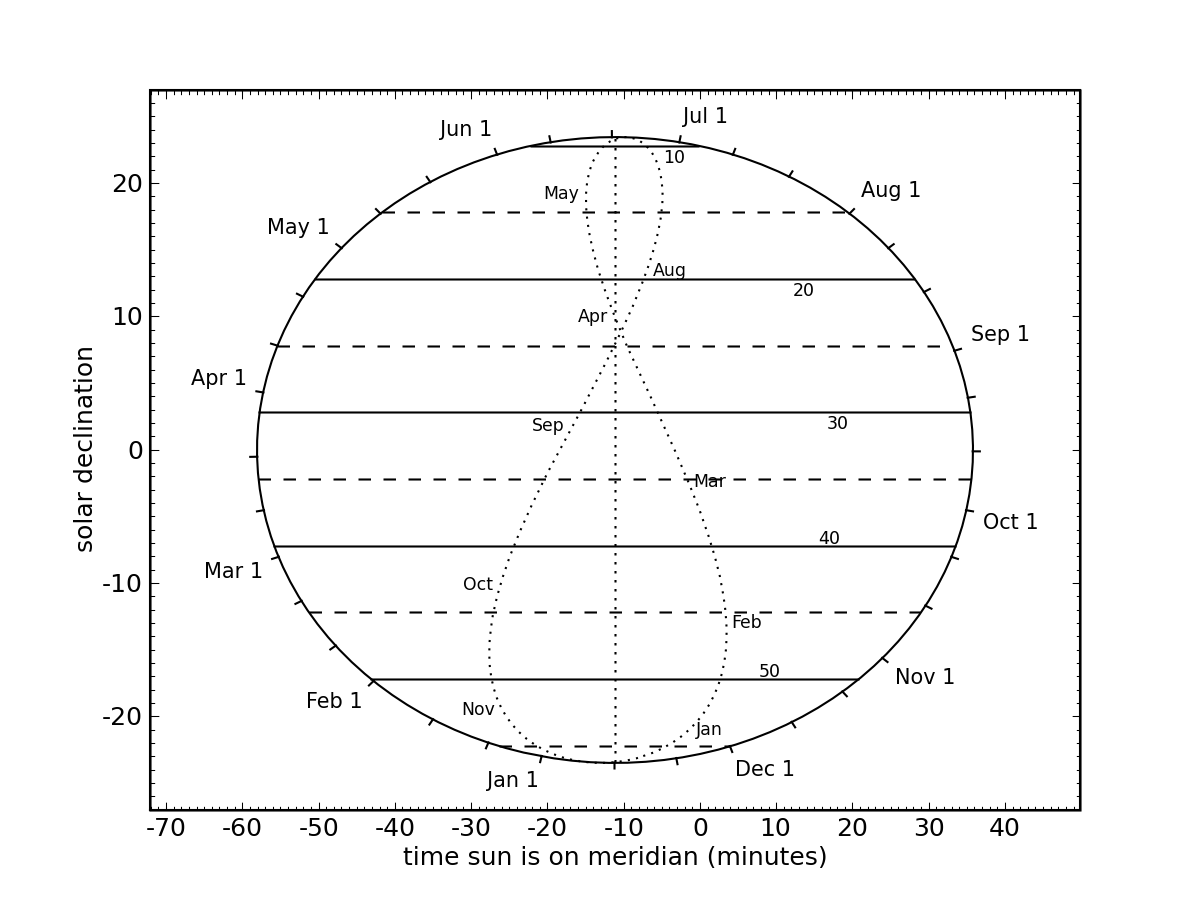
Above is a sample graphical calculator for San Diego, whose latitude is 32.8° and longitude is −117.2°. Ticks around the periphery of the circle are at the 1st, 10th, and 20th of every month. Horizontal lines indicate tilts of the array required for optimal geometry when the sun is on the meridian ("high noon"). If, for example, one has a tilt system for every 10° (as I do), one wants to switch at the dashed lines—switching from 20° to 10° on May 10, and back to 20° around July 31.
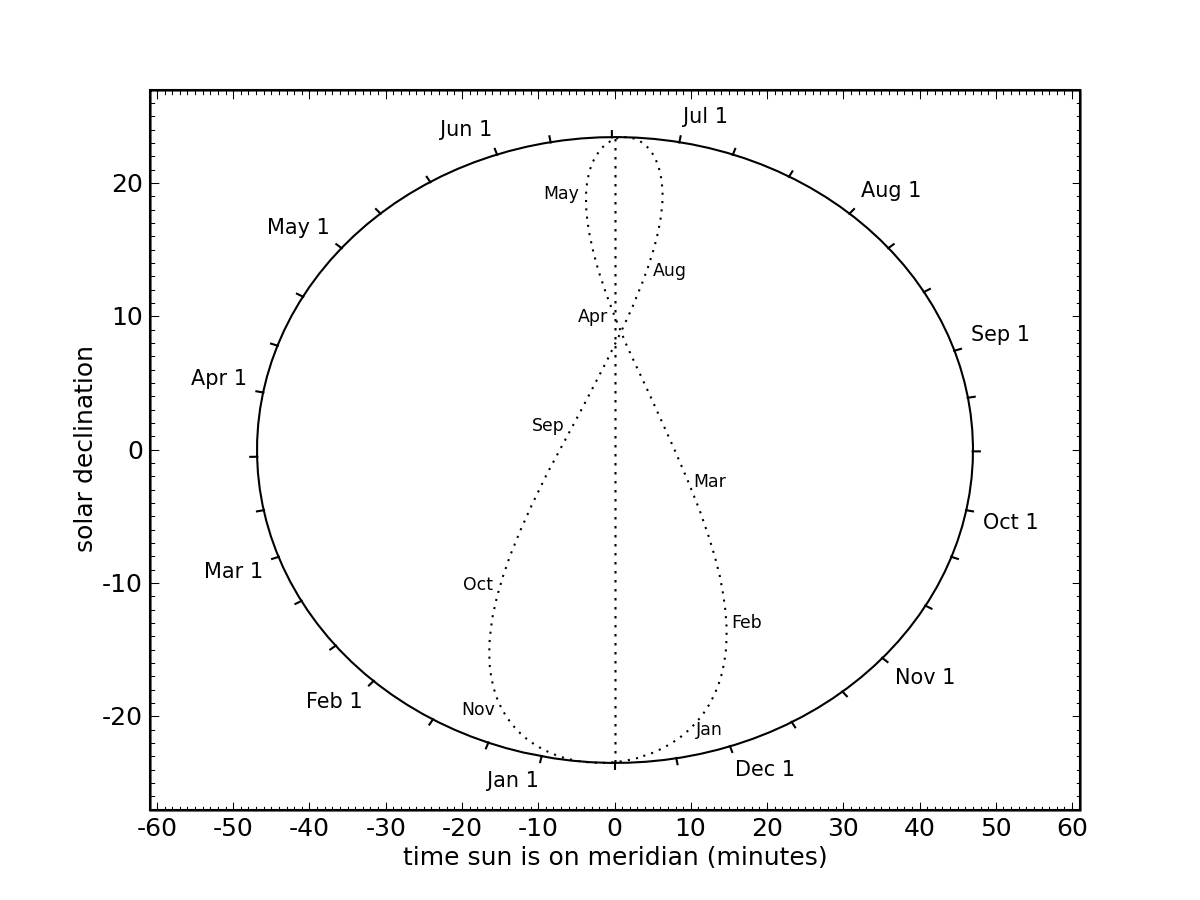
The other main feature of this graphical tool is the analemma at center. Together with knowledge of site longitude, this indicates when the sun will be at its highest point (due south, on the meridian) relative to noon within your time zone. This can help in orienting the arrays toward true south, and also indicates when you should expect maximum power delivery. Note that "noon" is 12:00 PM during standard time, and 1:00 PM during daylight savings. For example, on February 1 (picked for convenience of black horizontal line), we move to the appropriate side of the analemma at that declination (move horizontally), and find that in San Diego, the sun is due south at 12:03 PM. On May 10, local noon is at 12:45 PM (15 minutes before 1:00, keeping daylight savings in mind).
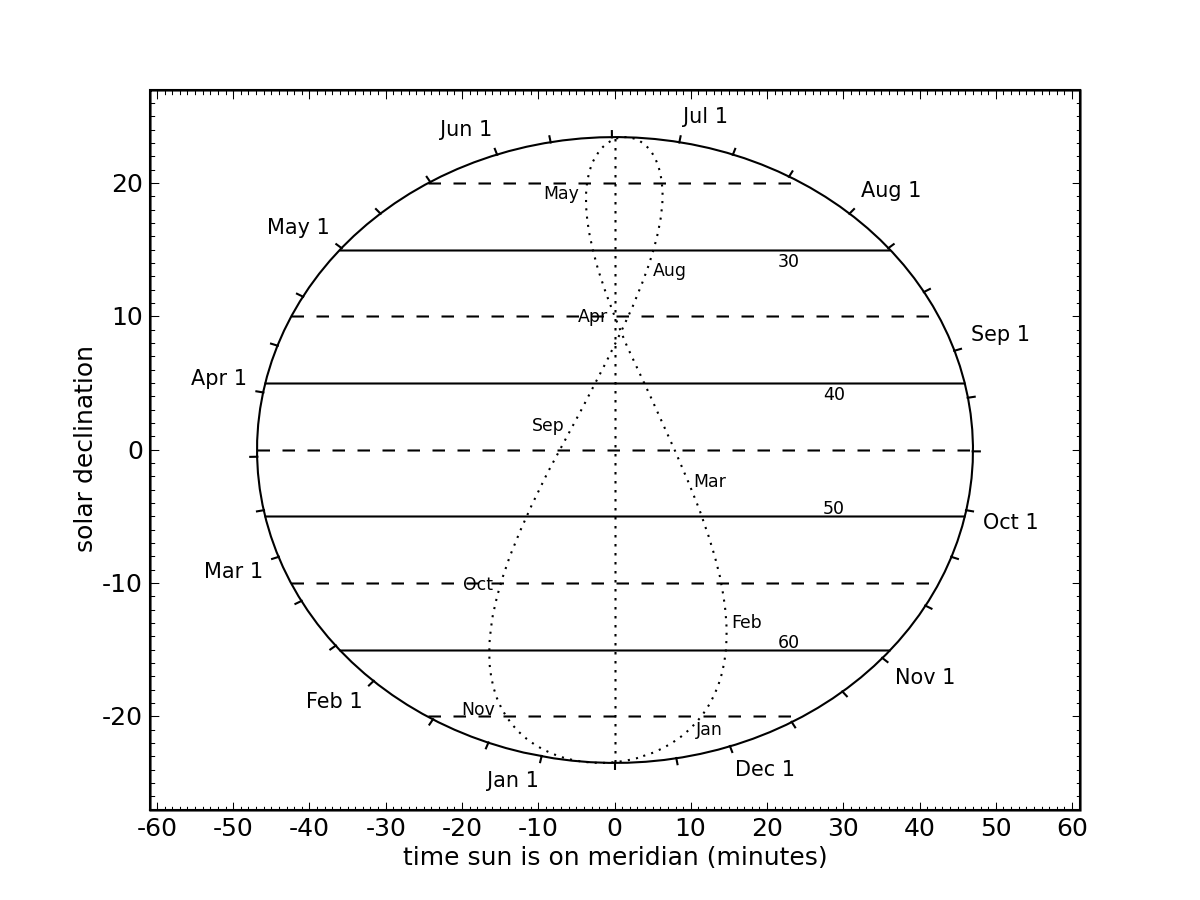
Above is a blank calculator onto which you can draw your own lines according to your latitude and your available tilt increments. Zero declination (see outer box scale) should correspond to your latitude. If you want to get local noon right for your site, slide the horizontal scale by four minutes for every degree you are off the canonical longitude for your time zone. These are multiples of 15° (75° W for US Eastern, 120° W for US Pacific, etc.). The vertical centerline of the calculator should correspond to a positive number if you are west of your time zone center (sun will be late), and negative if you are located to the east (sun will be early).
I have also prepared templates for standard mid-northern latitudes (centered on the time zone: Memphis consider yourself lucky!). Rather than print directly from your web browser, these files may work best if you save them to your machine first (try right-click) and use an appropriate image browser.
Finally, if you want to customize a graphical calculator for your specific latitude and longitude, use this submission form to put in your information (caveat: may require patience, as some intermittent bugs in the Python web service persist).
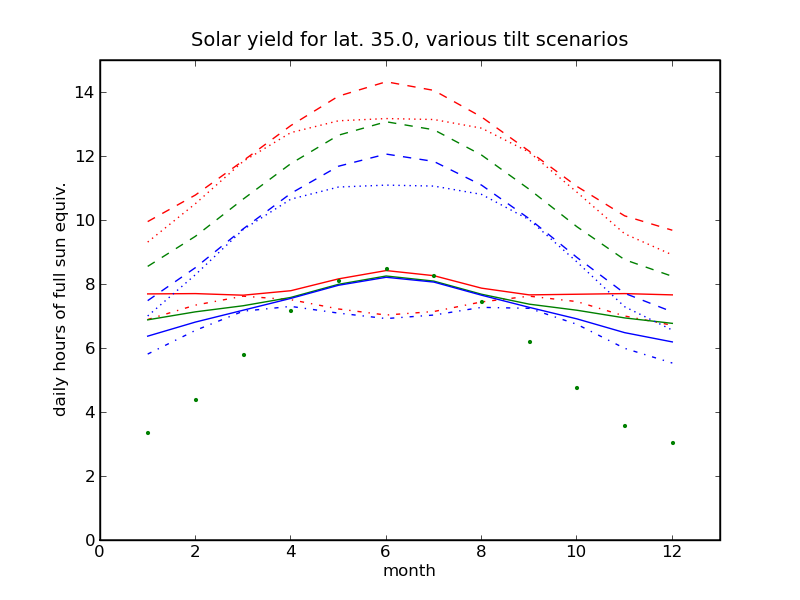
Click the plot above to view an analysis of solar yield for various panel tilt and tracking scenarios.
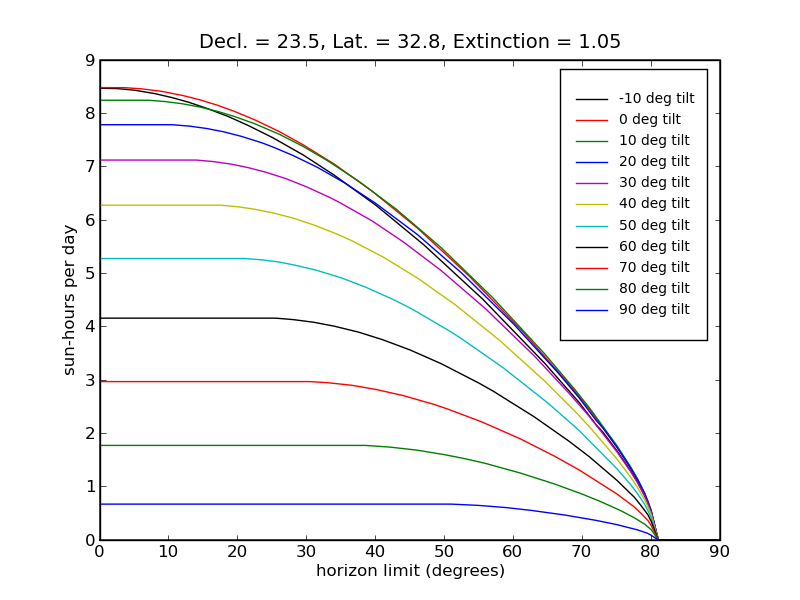
Click the plot above to view an analysis of solar yield as a function of panel tilt and horizon obstruction.
Note: This page is likely to be updated with new information and analyses. Please revisit if you find the content interesting.