24/7 Refrigerator
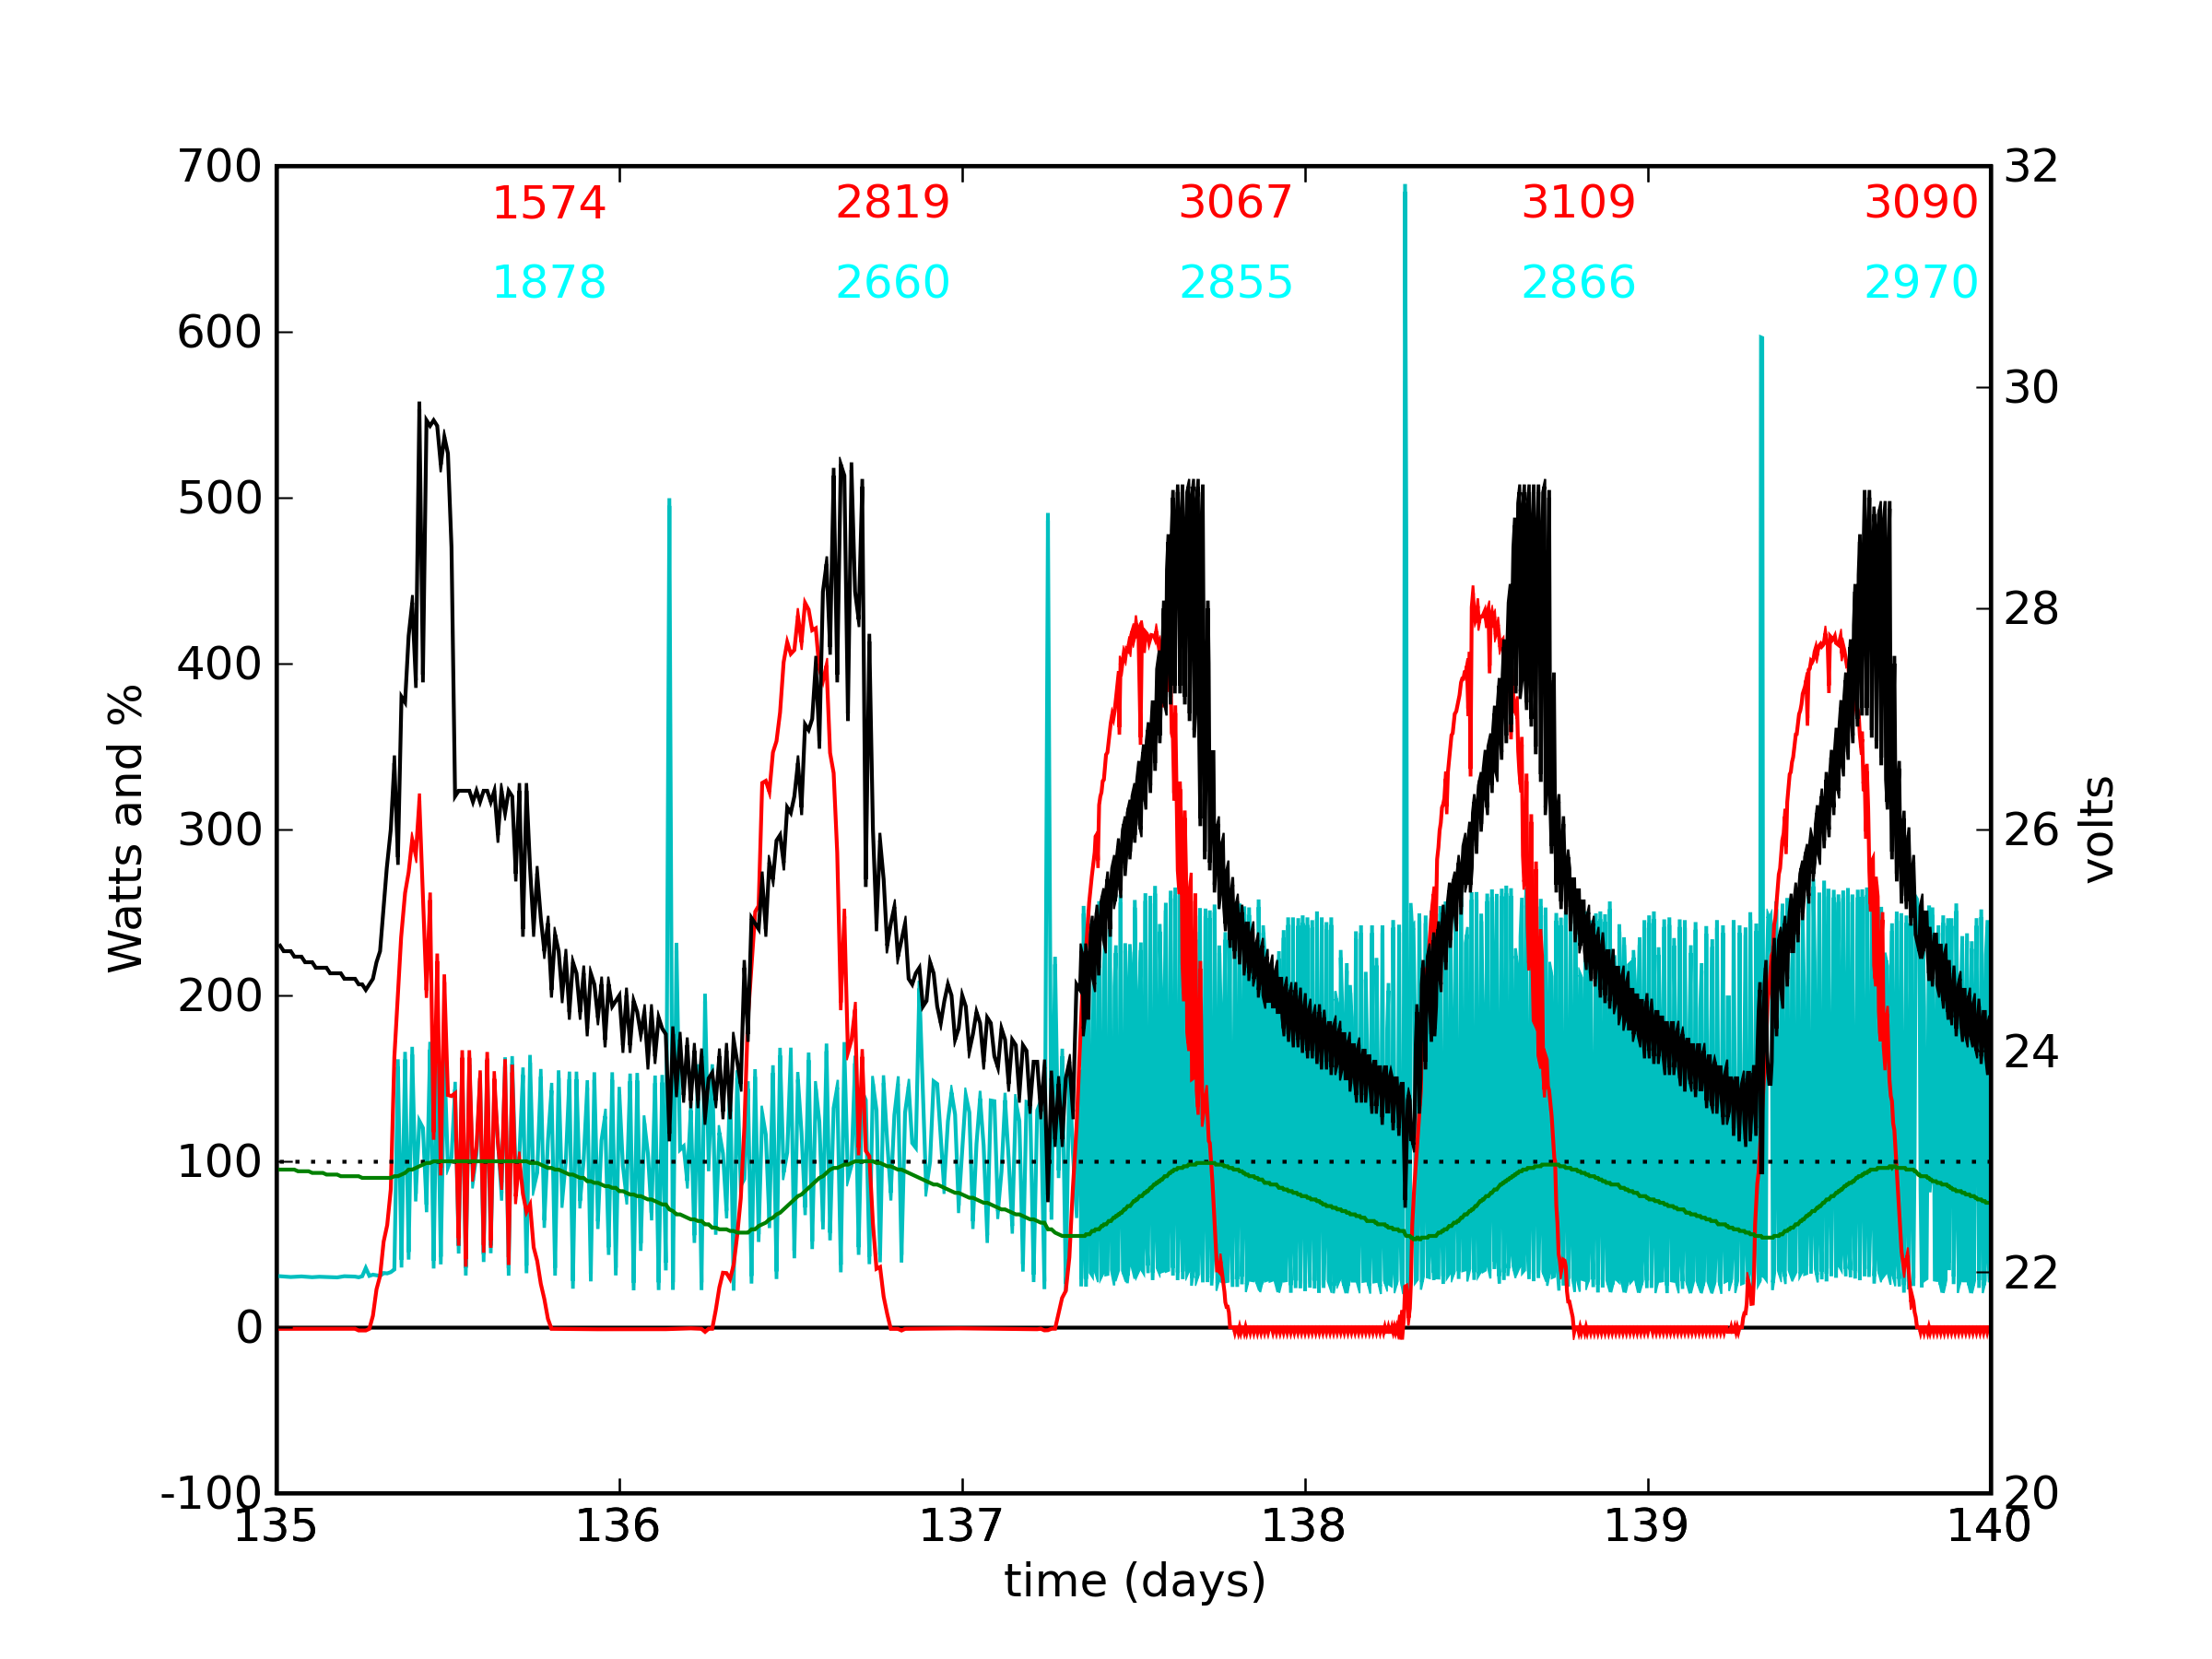
Now equipped with four 130 W panels, the system can handle the 75 W average load of my full-size refrigerator full-time during sunny periods. The fridge constitutes almost 40% of our electricity use, so this is starting to be a big deal. The series depicted above shows five days of continuous fridge use running off of solar power. The sampling for the first two days is crude, at 15 minutes, but reduced to 5 minutes for the last three days.
The large spike about once per day is the defrost cycle, following a rhythm from some other planet. The normal on-cycle following the defrost is always longer than the usual on-cycle, as the refrigerator has to get rid of the extra heat. This is evident in the poorer sampling period (larger spike for normal cycle), and is also apparent in the more finely sampled data, though not at this plot resolution.
The battery is getting back to nearly 100% each day (green curve), though it is slowly slipping from this mark. An extra few % of throughput or efficiency would let me run the refrigerator with exactly 4.0 panels. Note that the last three days all exceed 3 kWh of delivered solar energy. Naively dividing the delivered load energy by the solar input yields "efficiency" estimates of 93%, 92%, and 96% for the three days. But this analysis is in error since the battery state of charge is slowly slipping. Real long-term energy efficiencies measured for my batteries are closer to 80–85%.
You can also see that—aside from the first day, which had a light load—the battery never got to float stage. This is, in part, due to a peculiarity of the charge controller I am using. It prescribes 120 minutes for absorb stage. But if it must drop out of absorb state due to insufficient current when the fridge is on, the counter tracking time remaining for absorb state does not just sit idle: it reverses, prolonging the absorb-sentence. In other words, if the counter is down to 89 minutes when the fridge kicks on and pulls the battery below its absorb state voltage for five minutes, the counter will read 94 minutes left at the end of this. Because the duty cycle is close to 50%, it can get virtually stuck and never reach float stage. I think this is actually unfair, since the battery obviously quickly recovers from the on-state as if it had not happened (note the current demand reflected by the red curve in between the on-state periods in the high-resolution fridge plot).
Previous Data Set | Next Data Set