Horizon Impact on Yield
This page explores the impact of horizon and panel tilt on the solar yield. There are several ways to slice this. One may have a fixed tilt year-round (first example below). Or one may be able to tilt for optimal performance as a function of time in the year (second example), or one may decide to follow the sun, tilting the panel to point directly at the sun at local noon (last example). For each case, we can evaluate the performance as a function of horizon obstruction.
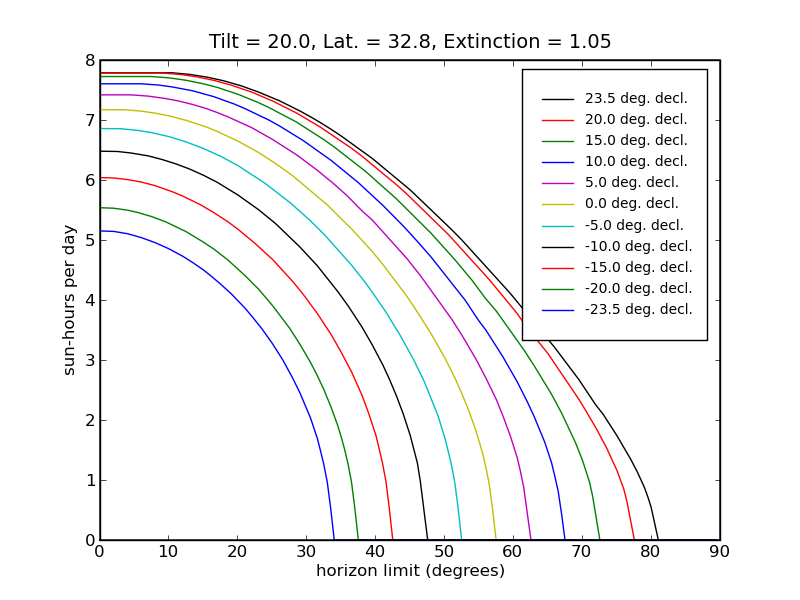
The plot above shows the performance of a south-facing panel tilted at 20° at north latitude 32.8° (San Diego) throughout the year. The solar declination ranges from −23.5° to +23.5° in a roughly sinusoidal fashion. Each curve, for each declination, indicates the number of equivalent full-sun hours per day received by the panel, taking into account projection effects and atmospheric extinction.
Horizon obstructions are also represented on the horizontal axis. For instance, in a site with a 20° horizon obstruction (assumed for simplicity to be at all azimuths), one would expect 4 hours of equivalent full-sun exposure at the winter solstice, and 7.7 hours at the summer solstice. This is compared to about 5.1 hours and 7.8 hours with no horizon obstruction.
If the horizon obstruction is not symmetric from one side of the sky to the other, one would simply average the result evaluated from the plot for both obstruction angles. In principle, one could represent a complex horizon on the plot by understanding the height at which the sun clears the horizon as a function of solar declination.
Similar plots to the one shown above have been prepared for different panel tilts, at:
Note that the degree of variation is greater for the 0° panel. The panel tilted to latitude delivers similar performance year-round, though the maximum daily delivery is not as high as the flat panel in summer.
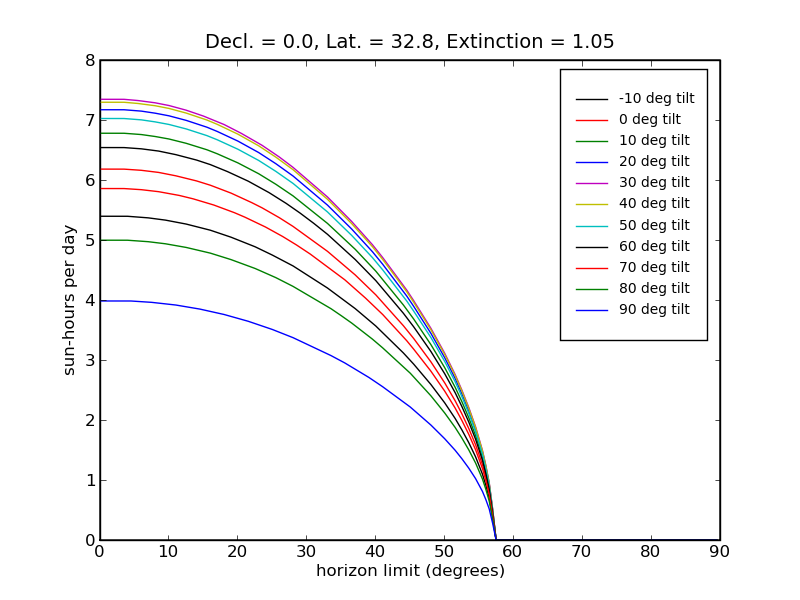
If the panel tilt is not fixed, one may want to know what tilt angle will maximize return for a given horizon condition. The answer will depend on the declination of the sun. The above plot is for 0° declination, corresponding to the equinoxes.
Similar plots to the one shown above have been prepared for different declinations, at:
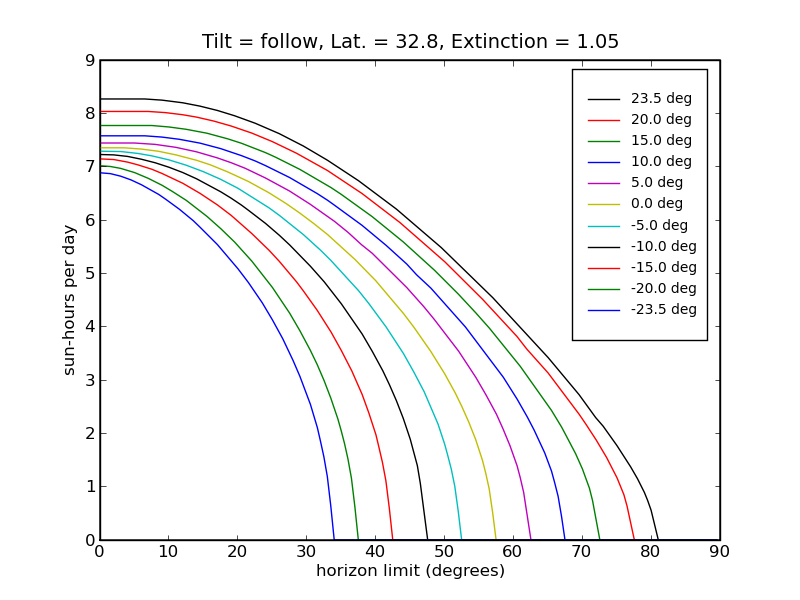
Finally, if one adjusts the tilt of the panel so that it points directly at the sun at local noon, the above plot results. The 0° horizon yields are now fairly similar throughout the year.