Tilt Scenarios and Yield
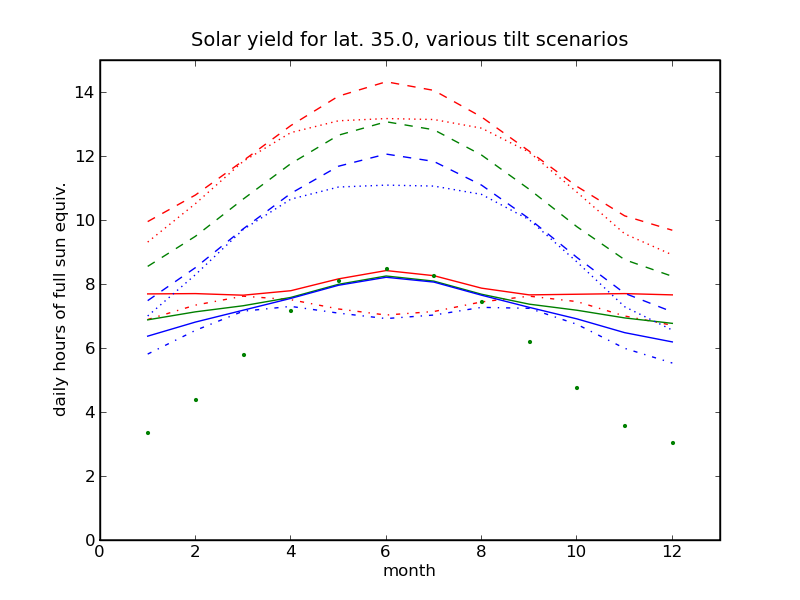
These curves indicate the solar yield one might expect in cloudless conditions throughout the year (monthly assessments) at 35° latitude for a variety of panel tracking/tilting scenarios.
The curves above are organized as follows:
Red curves represent a 0° (clear) horizon, with no extinction (as if in space), and is therefore impractical, but exposes limitations of geometry alone.
Green curves represent a 0° horizon, with 5% atmospheric extinction per airmass (okay for desert, underestimated for most cases).
Blue curves represent a 10° horizon, with 5% atmospheric absorption.
Based on the fact that the green curves tend to fall almost halfway between red and blue, some of the green curves are eliminated when the trends can be gleaned from the other curves. Also, this is useful because one might deduce that a 0° horizon with 10% extinction per airmass should look similar to the blue curve. Thus the blue curve may be more realistic for non-desert, clear horizon locations.
Dashed lines represent a full, 2-axis, tilt system that always keeps the panel pointed directly at the sun.
Dotted lines represent a 1-axis tracking system, with the axis parallel to the earth's rotation axis, and the panel tilted at this same angle. The dotted lines touch the dashed lines at the equinoxes, but depart for both solstices.
Solid lines are for the case of a variable south-facing tilt that follows the sun's declination (so that the panel is pointed directly at the sun at local noon.
Dot-dash lines are for the case of a fixed south-facing tilt at the site latitude. Note that this is the case that is most nearly constant all year long. But the horizon and extinction effects cut into the yield during the winter months, when the sun spends more of its time low in the sky.
The green dots are for the case of a flat panel (pointing straight up to zenith), in the 0° horizon, 5% extinction case. This does well in the summer, but is a poor choice for winter.
The numbers are as follows:
| Panel Tilt | Red: geometry only | Green: 0° horizon, 5% extinction | Blue: 10° horizon, 5% extinction |
| 2-axis track | 12.00 | 10.73 | 9.74 |
| 1-axis track | 11.51 | 10.29 | 9.35 |
| Tilt to follow declination | 7.85 | 7.43 | 7.22 |
| Tilt to latitude | 7.25 | 6.89 | 6.72 |
| Flat, horizontal | 6.13 | 5.88 | 5.78 |